-
10 min read
FinOps visibility: How to see costs across your entire data, AI, and cloud stack

TL;DR
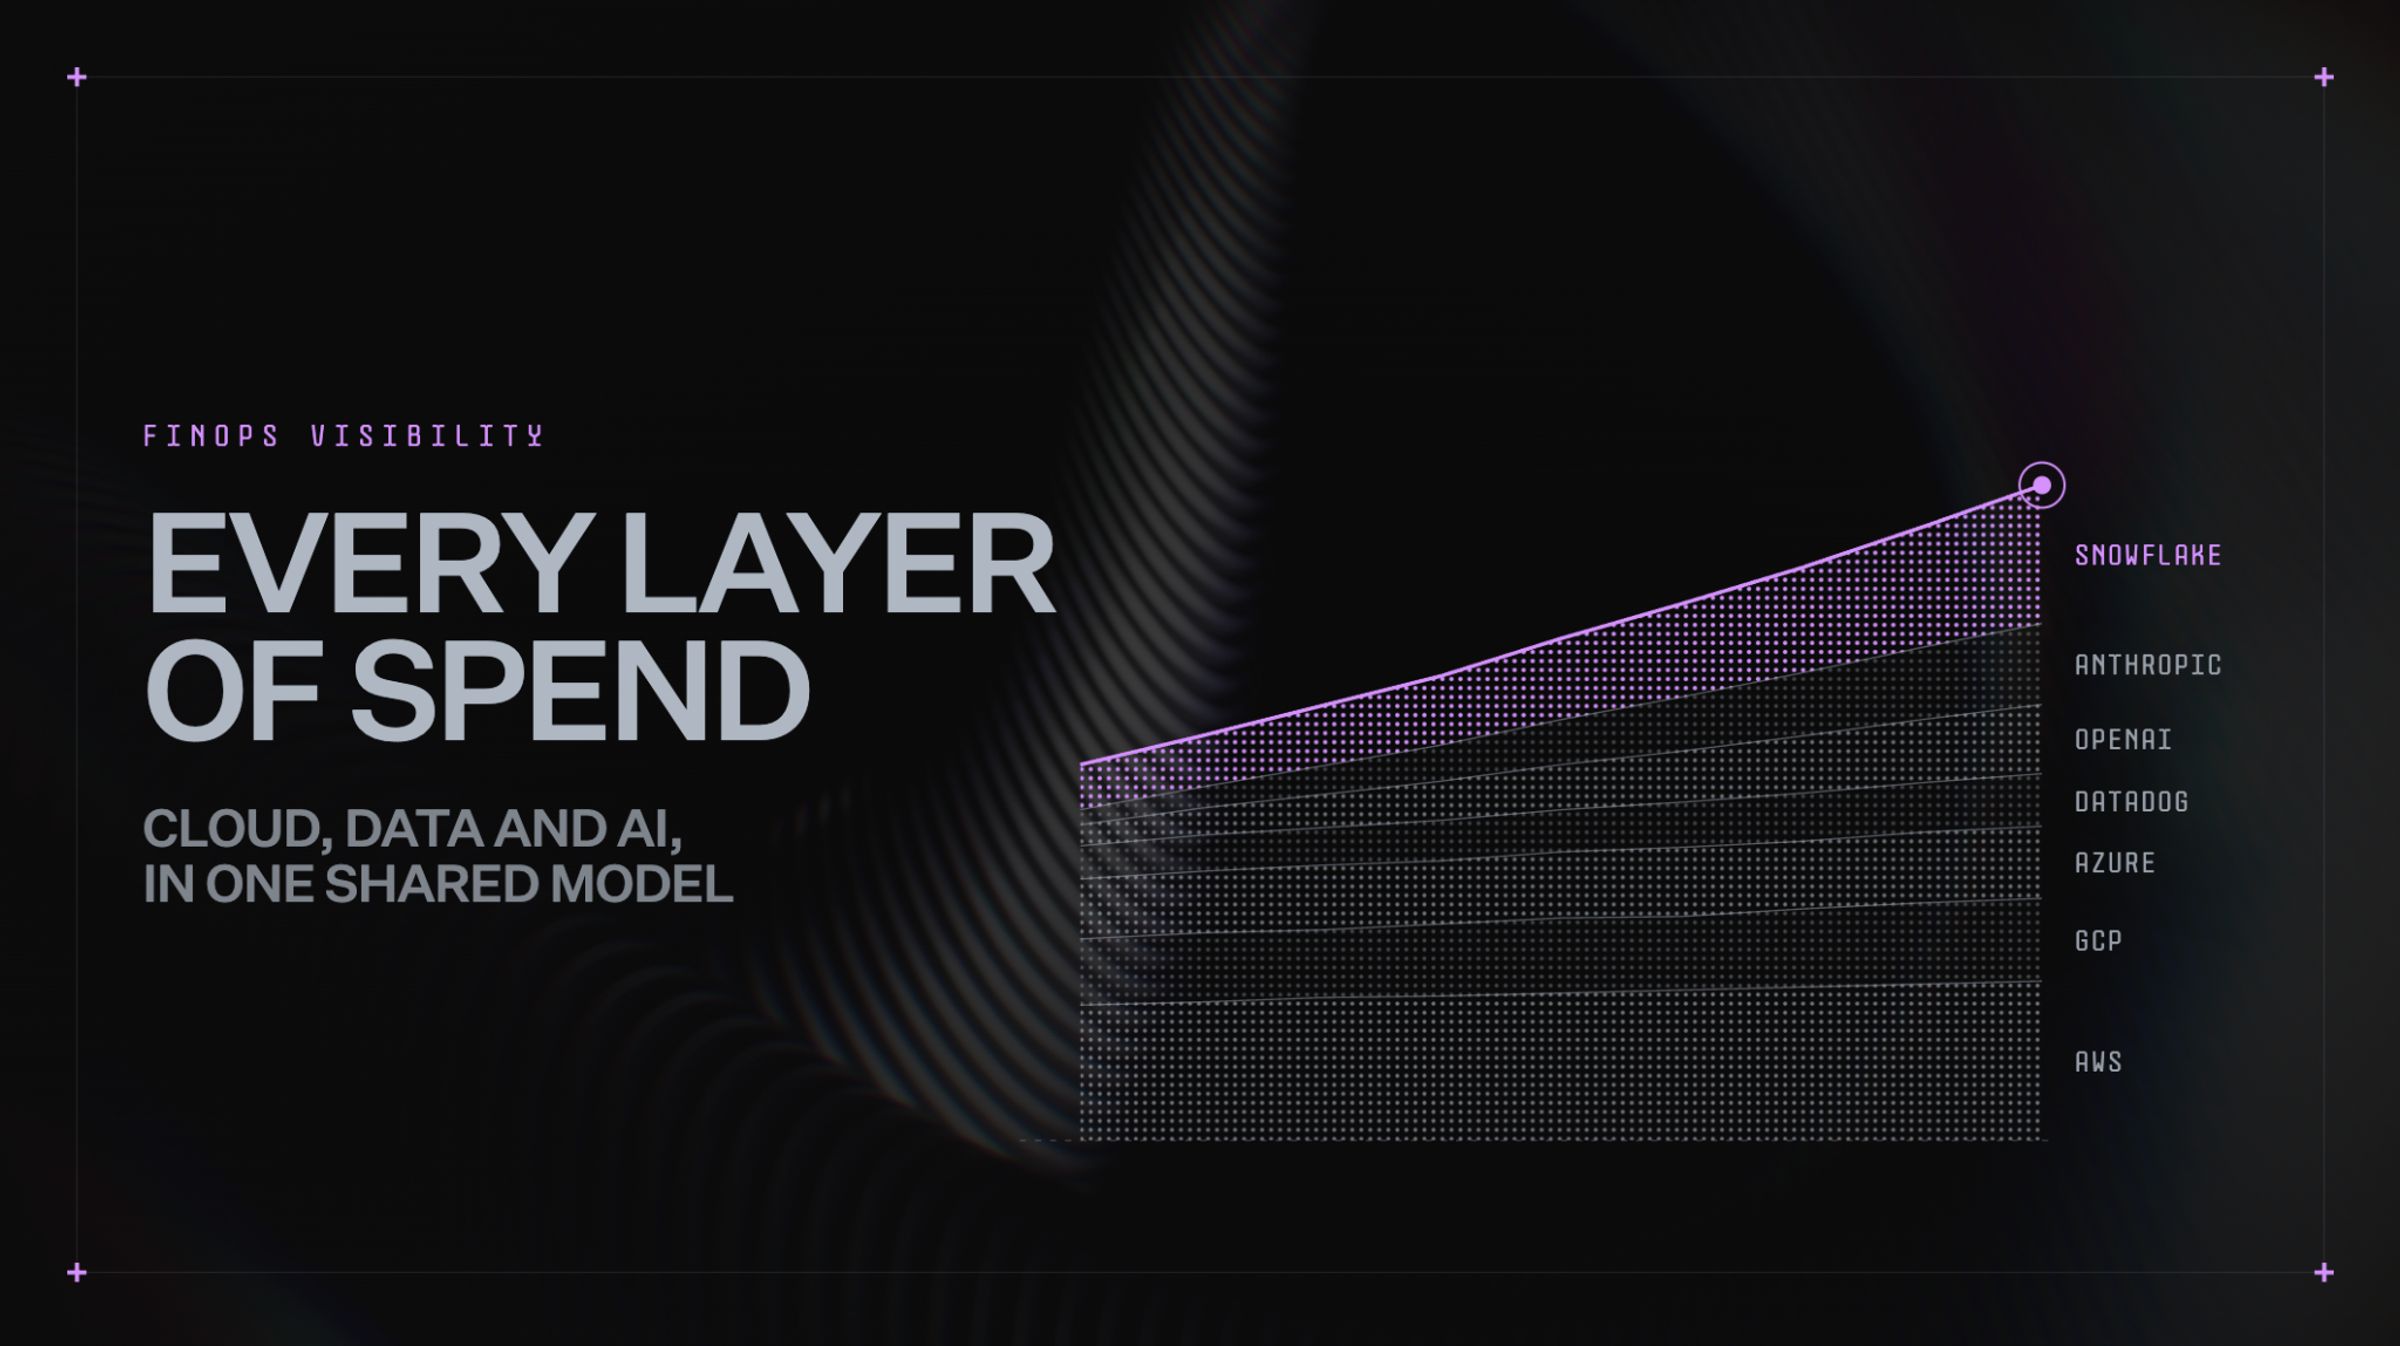
- FinOps now covers more than cloud. The FinOps Foundation’s 2026 Framework expands the practice to include data and AI spend.
- AI and data spend often becomes a blind spot. It sits in separate provider portals, where no one can compare it with cloud.
- North.cloud supports Snowflake, Anthropic, OpenAI, and Datadog. Our integrations library connects each one read-only, next to your AWS, GCP, and Azure spend.
- One view of every team’s full cost. Leaders can track budgets, spot changes early, and share showback statements across the whole stack.
- Full visibility is free to start. North’s free tier includes every integration in the library.
FinOps used to mean one thing: keeping spend across Amazon Web Services (AWS), Google Cloud Platform (GCP), and Microsoft Azure under control.
This year, the FinOps Foundation released the 2026 FinOps Framework, redefining what FinOps covers inside an organization. A FinOps practitioner is now expected to manage value across data, AI, and cloud spend.
Multi-cloud visibility tools already exist, and most show what you spend with each provider well. What's still missing is a financial operations layer, a single system where those categories sit side by side instead of scattered across separate tools.
We built North as that financial operations layer, for teams across every industry. Beyond the major clouds, North connects natively to the AI and data platforms where modern spend lives. Today, our integrations library connects to Anthropic, OpenAI, Snowflake, and Datadog, with more to come.
Why is FinOps expanding beyond cloud costs?
FinOps was built to solve one problem: make sure cloud spend stayed visible to engineering, finance, and the business teams responsible for it, so savings weren't quietly slipping through the cracks. For years, that meant AWS, GCP, Azure, and any other cloud providers a company ran on.
AI and data spend have grown fast enough to need the same treatment. A cost number only helps the business once it sits next to everyone else's spend. Until then, nobody outside the team paying that bill can compare it, question it, or weigh it against anything else the company spends money on.
This is what we call a blind spot: a cost line that sits outside everyone else's shared model, no matter how large it grows. Knowing the total on a Snowflake invoice is not the same as knowing which warehouse, workload, or query is driving it. Without that detail, an idle warehouse, an oversized instance, or a pipeline nobody shut down can sit there unnoticed, even by the team paying the bill.
That specificity is what makes it possible to renegotiate a contract, retire a service, or bring a real number to leadership.
What changes once a data team's spend is visible
Consider a typical e-commerce software company. Its product follows a straightforward workflow: a customer browses, adds something to their cart, buys it, and waits for the order to ship, with support and refunds handling whatever comes after. Behind that workflow sits an analytics suite, and behind the analytics suite sits a data team. In a setup like this, the biggest cost often isn’t AWS, GCP, or Azure. It’s Snowflake.
A VP of Infrastructure wants to know what each team spends and compare it against what that team's work is worth to the business. Right now, that person has a blind spot:
- The cloud bill shows nothing about Snowflake.
- The workaround is a spreadsheet, or another tool used just to track that one thing.
- A retroactive number, not an accurate, up-to-date view of spend.
Think of someone tracking spend across two credit cards and a checking account. Each statement alone only shows what happened on that one account. Pull all three into one budgeting app, and suddenly there's a real trend to look at: spending climbing, falling, or holding steady, something no single statement could show on its own.
Closing the blind spot on a data team's Snowflake spend works the same way. Once it sits next to that team's cloud spend instead of off on its own, the VP of infrastructure finally has one real trend line for that team, not two disconnected numbers in two different places.
What is a showback statement?
A trend line only answers one question: is spend moving. Acting on it takes more detail than that, specifically when answering the following questions.
- Which workload is driving the number?
- Which service is it tied to?
- Which usage type is behind it?
A showback statement is what delivers that detail: a report handed to a team's leader, showing exactly what the team spent, without billing that spend against its budget directly. Once that leader has the number, accountability shifts to the team actually running the workload, the people best positioned to make it more efficient.
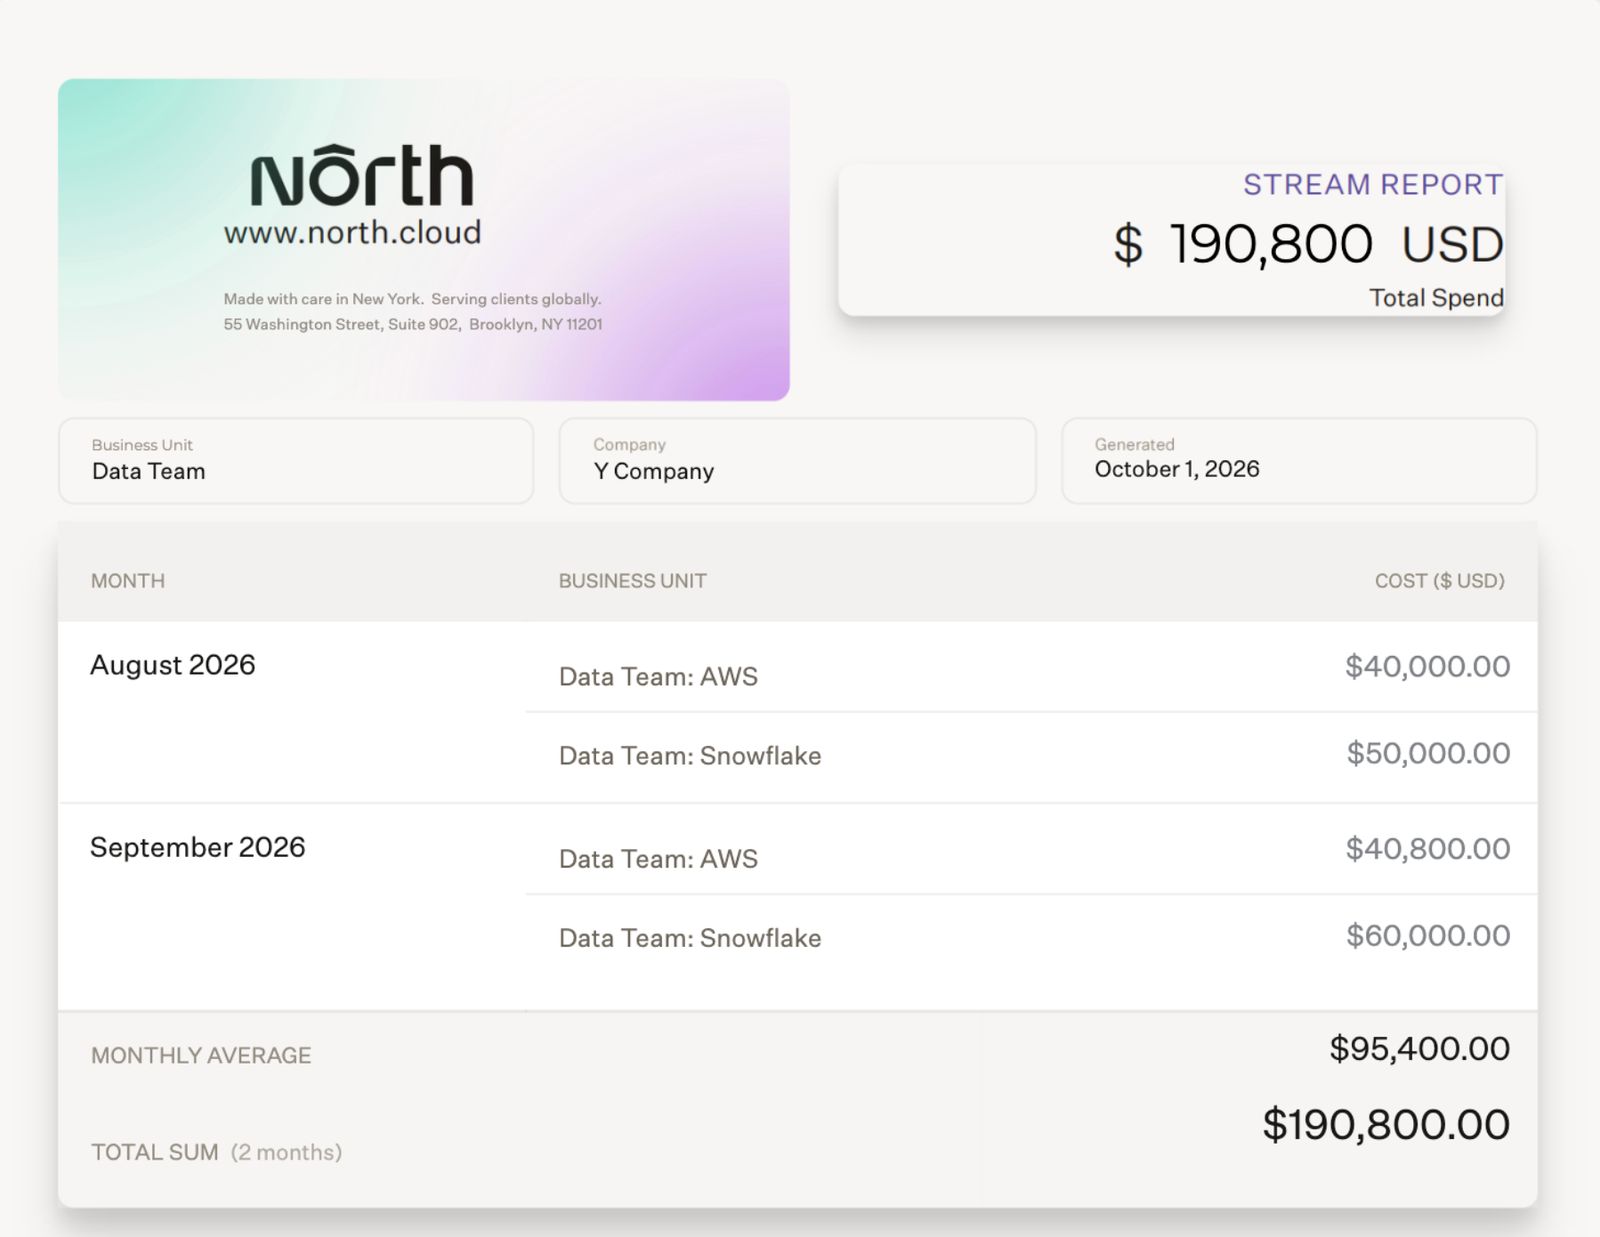
An example showback statement from Coststreams, North’s cost allocation tool, with one team’s AWS and Snowflake spend by month.
That shift isn’t just about telling a team to cut costs. One FinOps practitioner described it well: engineers and team leads stop tuning out a number once it's framed as an efficiency question rather than a cost one. Nobody wants to hear they're being wasteful, but almost everyone wants to know if they could be running leaner. A showback statement is what gives them the number to check that against.
How to track cloud, AI, and data spend inside North
CostLoops, North’s integrations library, is built for exactly this. It brings a provider’s spend into view, right alongside your cloud spend.
Take that same data team from the earlier example. The VP of Infrastructure connects Snowflake as a CostLoop. Its month-to-date spend now appears on North’s homepage, right alongside the team’s AWS spend.
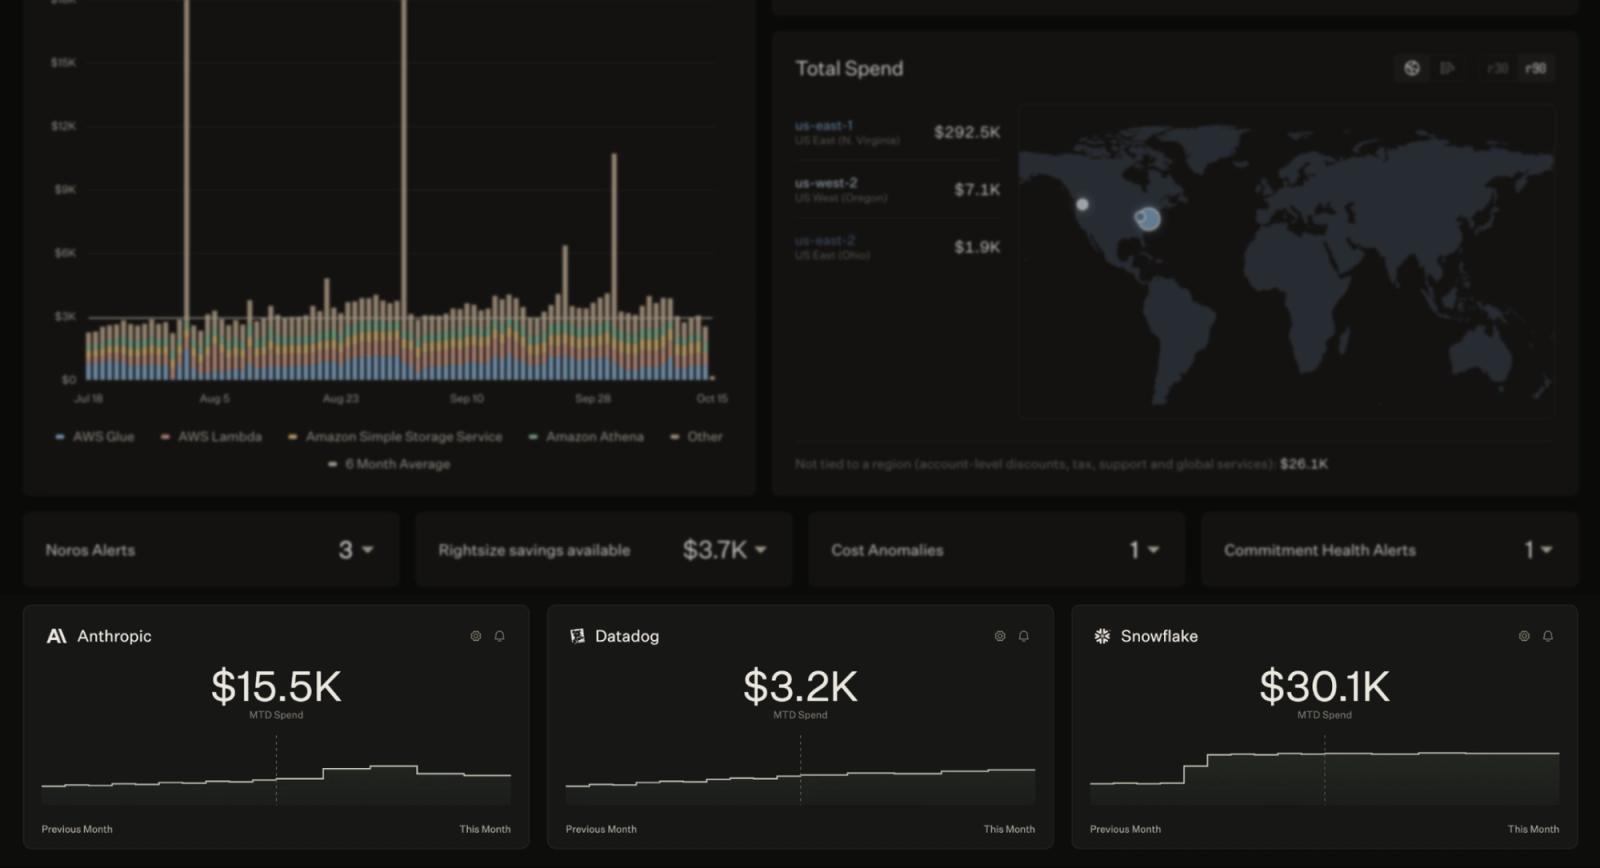
North’s homepage gives each connected CostLoop its own month-to-date spend card, right below your AWS spend. Here, the Snowflake card shows spend stepping up this month.
From there, that spend flows into Coststreams, North’s cost allocation tool. The data team’s Snowflake spend joins their AWS spend inside their business unit. Both are tracked in real time against the same budget.
At the end of the quarter, the VP reviews budget status for every business unit. Most are on track. The data team stands out, with spend up 12% over last month and 6% over budget. Its breakdown points to Snowflake compute, mostly overage usage billed at on-demand rates.
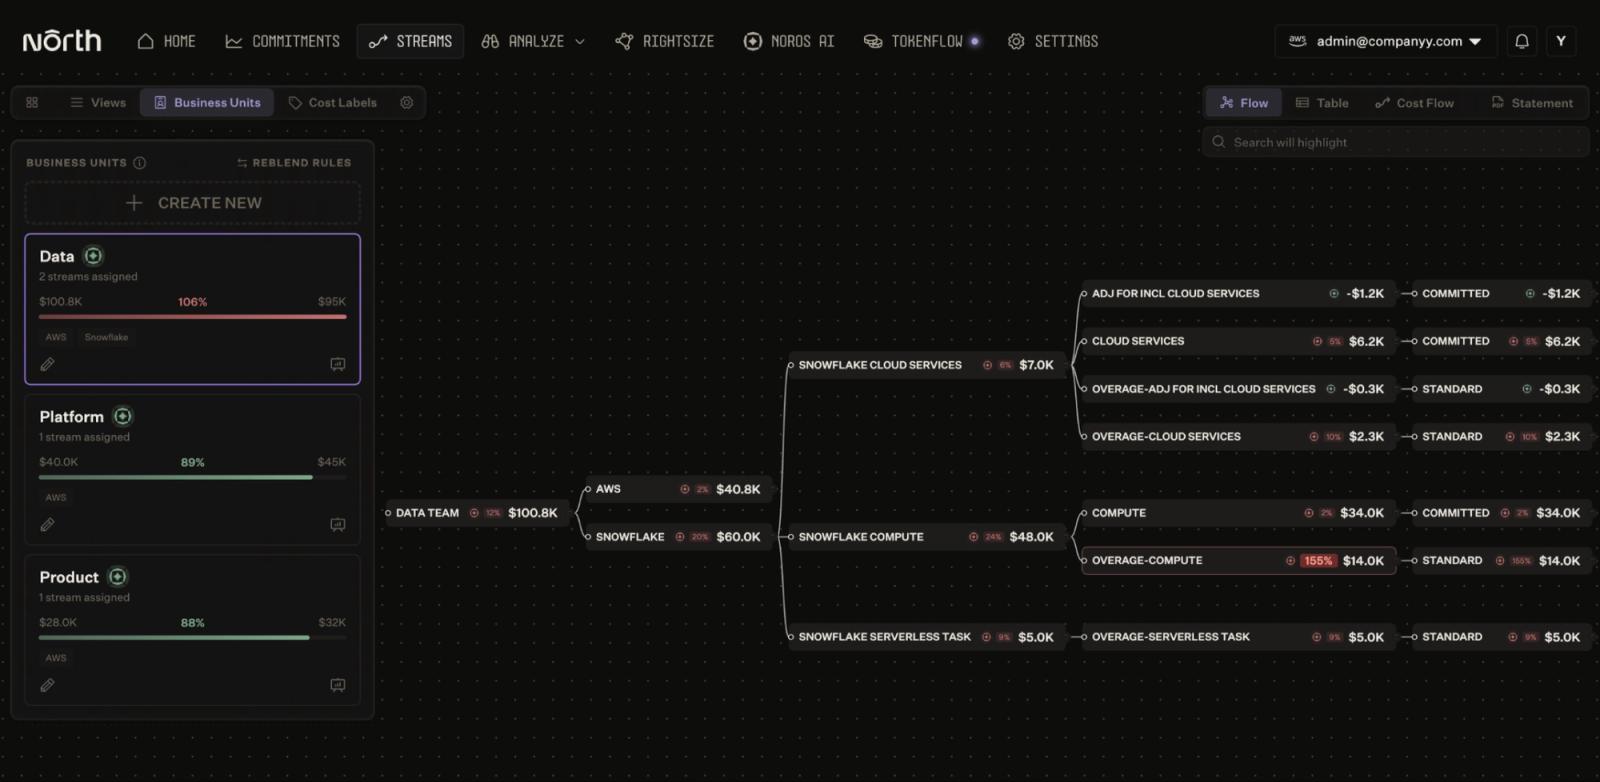
In North’s Coststreams, the data team’s business unit sits 6% over budget. Its flow chart traces the increase to Snowflake overage compute, up 155% from last month.
To see when the change started, the VP opens the same spend in Analyze. Splitting by provider, then by service, separates Snowflake from AWS on one chart. Comparing September against August shows the increase started mid-September, rather than following a normal pattern for this team.
The VP can also ask Noros, North’s FinOps Agent, about this spend directly. A question like “Show my Snowflake cost by service” pulls up the same breakdown, without setting up any splits.
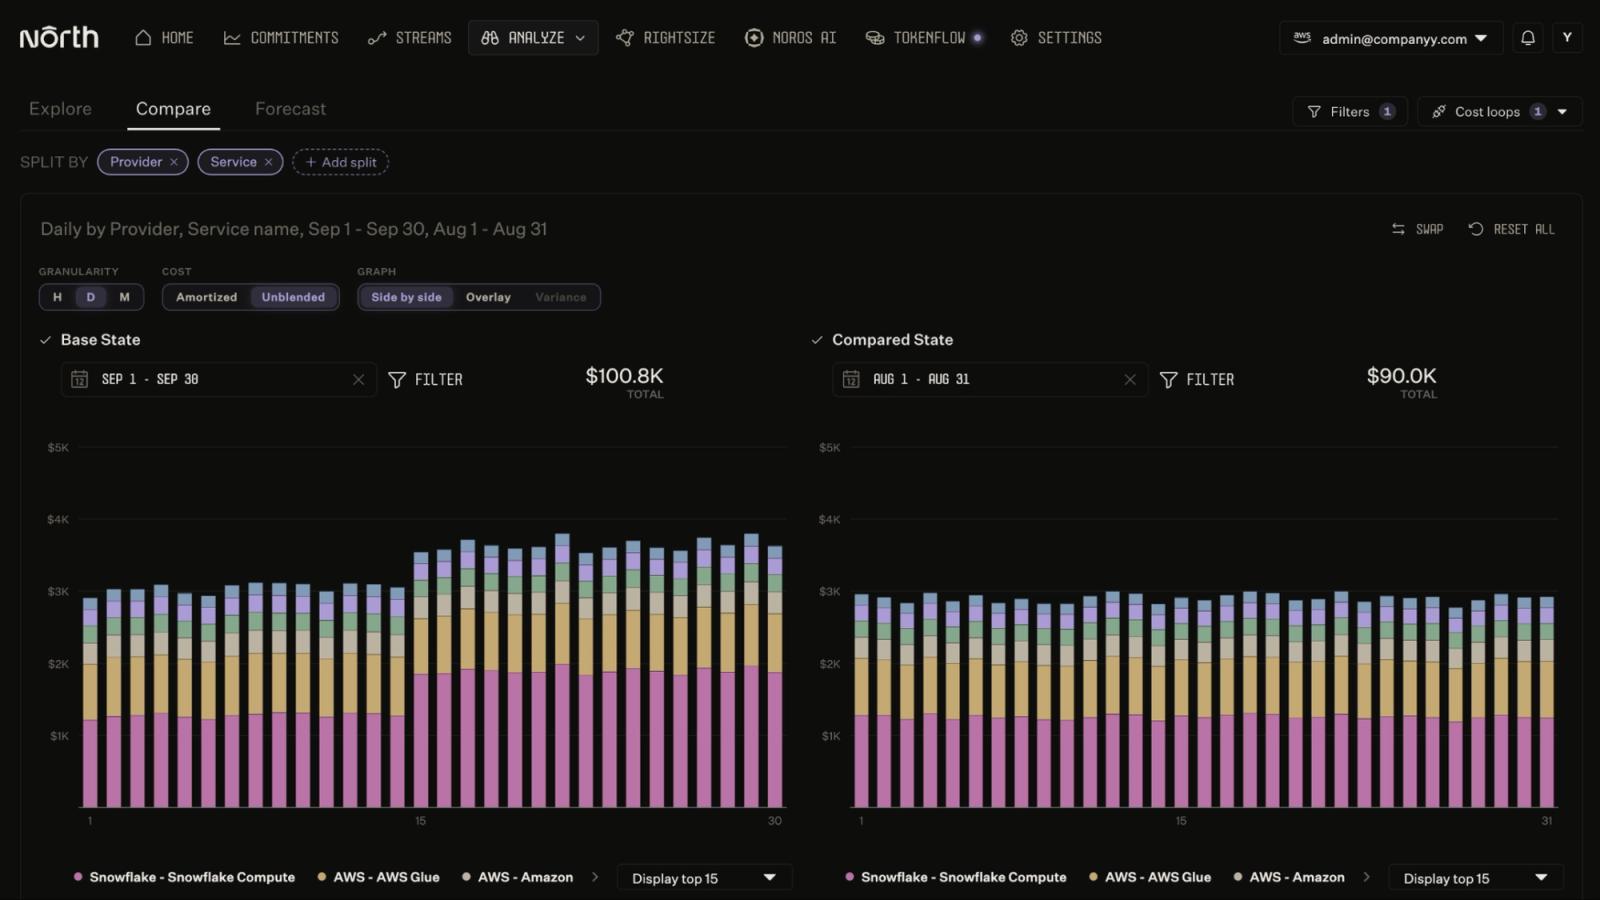
Comparing two months side by side in North’s Analyze tool separates a one-off spike from a lasting change. Here, Snowflake Compute steps up on September 15 and stays there, while AWS holds steady.
There’s nothing to assemble the night before. The VP opens the data team’s business unit and downloads a showback statement. It shows the team’s August and September spend in one report, ready for the review. The data team’s leader gets the same number, framed as a question about running leaner.
Pulled straight from North, the data team’s showback statement is ready for the Q3 review. Snowflake spend rose from $50,000 to $60,000 month over month.
Today, North connects to Snowflake, Anthropic, OpenAI, and Datadog, with more on the way. Here's what that means for each one specifically.
Tracking warehouse spend: Snowflake
This is the spend from the data team example earlier in this piece. Once connected, Snowflake spend splits into its own billing categories:
- Snowflake Compute
- Snowflake Cloud Services
- Snowflake Serverless Task
Each category can also be traced to the warehouse behind it. That way, a data team’s leader sees which part of their usage is driving the number.
Snowflake spend also carries a pricing term, which shows how that usage was billed:
- Committed
- Standard
- Other, which covers usage paid with free or rebate credits
Usage labeled Overage, such as Overage-Compute, was billed at on-demand rates. If a data team’s standard spend holds steady month after month, a commitment could cover it. Seeing that split before a renewal gives the team a real number to negotiate with.
Tracking Claude usage: Anthropic
Anthropic spend breaks down by:
- Model, by version
- Workspace
- Usage type: uncached input, cache read, cache write, and output tokens
Tool charges, such as web search and code execution, appear under their own names. Putting cache reads next to uncached input for the same model shows whether caching is saving what it should. Claude Code usage gets its own line too, so it doesn’t disappear into a broader API total.
Tracking GPT usage: OpenAI
OpenAI spend covers the whole organization, broken down by:
- Project
- User
- API key
- Model, by version
North reads usage across ten separate endpoints, so spend beyond chat completions is included. That covers:
- Images and audio
- Vector stores
- Code interpreter sessions
- File and web search calls
A cost hiding in image generation or a forgotten vector store shows up next to Claude and cloud.
Tracking monitoring spend: Datadog
Monitoring is part of the cost of running infrastructure, not separate from it. Still, its cost is often reviewed apart from the systems it watches. With Datadog spend inside North, a platform team’s usage shows up as a trend someone can own, before it’s the invoice that breaks the news.
Datadog spend splits by:
- Service, meaning Datadog products like Infra Hosts or Indexed Logs
- Usage type
- Pricing term: Committed or Standard
The committed and standard split works the same way it does for Snowflake. It shows how much steady monitoring usage is billed outside a commitment. Datadog spend also rolls straight into a business unit without setting up tags first.
How to get started with full-stack FinOps visibility
The FinOps Foundation expanded its own definition this year for a reason: cloud, AI, and data spend now belong in one conversation. A blind spot in any one of them costs the same way, quietly, until someone finally measures it.
CostLoops is how North closes that gap. Connect Snowflake, Anthropic, OpenAI, or Datadog, and that spend stops living in its own portal. It sits inside the same business unit, the same budget, and the same showback statement as your cloud spend.
North's free tier already includes full visibility into every CostLoop integration, alongside your cloud spend. Explore North's free tier to see what full visibility across your entire stack looks like for your team.
FAQs
Answers to common questions about tracking cloud, AI, and data spend in one place.
How do you track AI spend across providers like Anthropic and OpenAI?
AI spend usually sits inside each provider's own billing portal, separate from cloud and everything else a company tracks. Seeing it in one place takes a tool that reads usage and cost directly from each provider's application programming interface (API) and lines it up against your other spend.
North.cloud does this through a CostLoop, a read-only connection to a provider like Anthropic or OpenAI. Once connected, that spend splits by model, workspace, and usage type, sitting right alongside cloud in the same reporting.
How do you track data platform spend like Snowflake?
A platform like Snowflake bills separately from cloud, so its cost usually sits outside the model a FinOps team already uses to track Amazon Web Services (AWS), Google Cloud Platform (GCP), and Microsoft Azure spend, even though it can be one of the largest infrastructure costs at a company.
North.cloud closes that gap with a CostLoop, a read-only connection to Snowflake that brings its spend into the view as cloud. Spend then splits by billing category, so a team can see exactly what's driving it.
How do you get full visibility across AI, cloud, and data spend?
Getting full visibility means bringing usage and cost from every provider, cloud, AI, and data, into one shared model, rather than checking each provider's own portal separately. Without that, spend can be tracked closely in each place and still be impossible to compare across the business.
North does this by connecting natively to AWS, GCP, and Azure for cloud spend, and to AI and data platforms like Snowflake, Anthropic, OpenAI, and Datadog through CostLoops. Every connection is read-only, and all of it lands in the same reporting, the same budgets, and the same showback statements. Full visibility across every connected provider is included in North's free tier.
What integrations does North support?
North connects natively to the major cloud providers, Amazon Web Services (AWS), Google Cloud Platform (GCP), and Microsoft Azure, and to AI and data platforms beyond cloud through CostLoops: read-only connections to providers like Snowflake, Anthropic, OpenAI, and Datadog.
Each connection is read-only, so every integration shows up in the same reporting, split the same way, alongside cloud spend.
What is a showback statement?
A showback statement is a report that shows a team exactly what it spent, without billing that spend against its budget directly. It gives the team responsible for a cost visibility into it, so a conversation about spend has real numbers behind it instead of an estimate.
In North, a showback statement is generated at the business unit level and downloaded as a PDF whenever it's needed, built from the same spend and budget data already being tracked in that business unit.
How do you track Snowflake spend in North?
North tracks Snowflake spend through a CostLoop, a read-only connection set up with a dedicated service account. Once connected, Snowflake spend splits into its own billing categories, Snowflake Compute, Snowflake Cloud Services, and Snowflake Serverless Task, so a data team can see which part of its usage is driving the number.
How do you track Claude usage in North?
North tracks Claude usage through an Anthropic CostLoop, a read-only connection to your Anthropic organization. Once connected, usage splits by model, workspace, and usage type, including cached versus uncached input cost, with Claude Code usage tracked as its own separate line.
How do you track OpenAI usage in North?
North tracks OpenAI usage through an OpenAI CostLoop, a read-only connection to your OpenAI organization. Once connected, usage shows up across ten endpoints, including chat completions, images, audio, and vector stores, broken down by project, user, API key, and model.
How do you track Datadog spend in North?
North tracks Datadog usage through a Datadog CostLoop, a read-only connection to your Datadog account. Once connected, spend splits by service and usage type, and rolls into a business unit without requiring tags to be set up first.