-
2 min read
Enhanced visibility: Filter cloud spend by 90+ dimensions

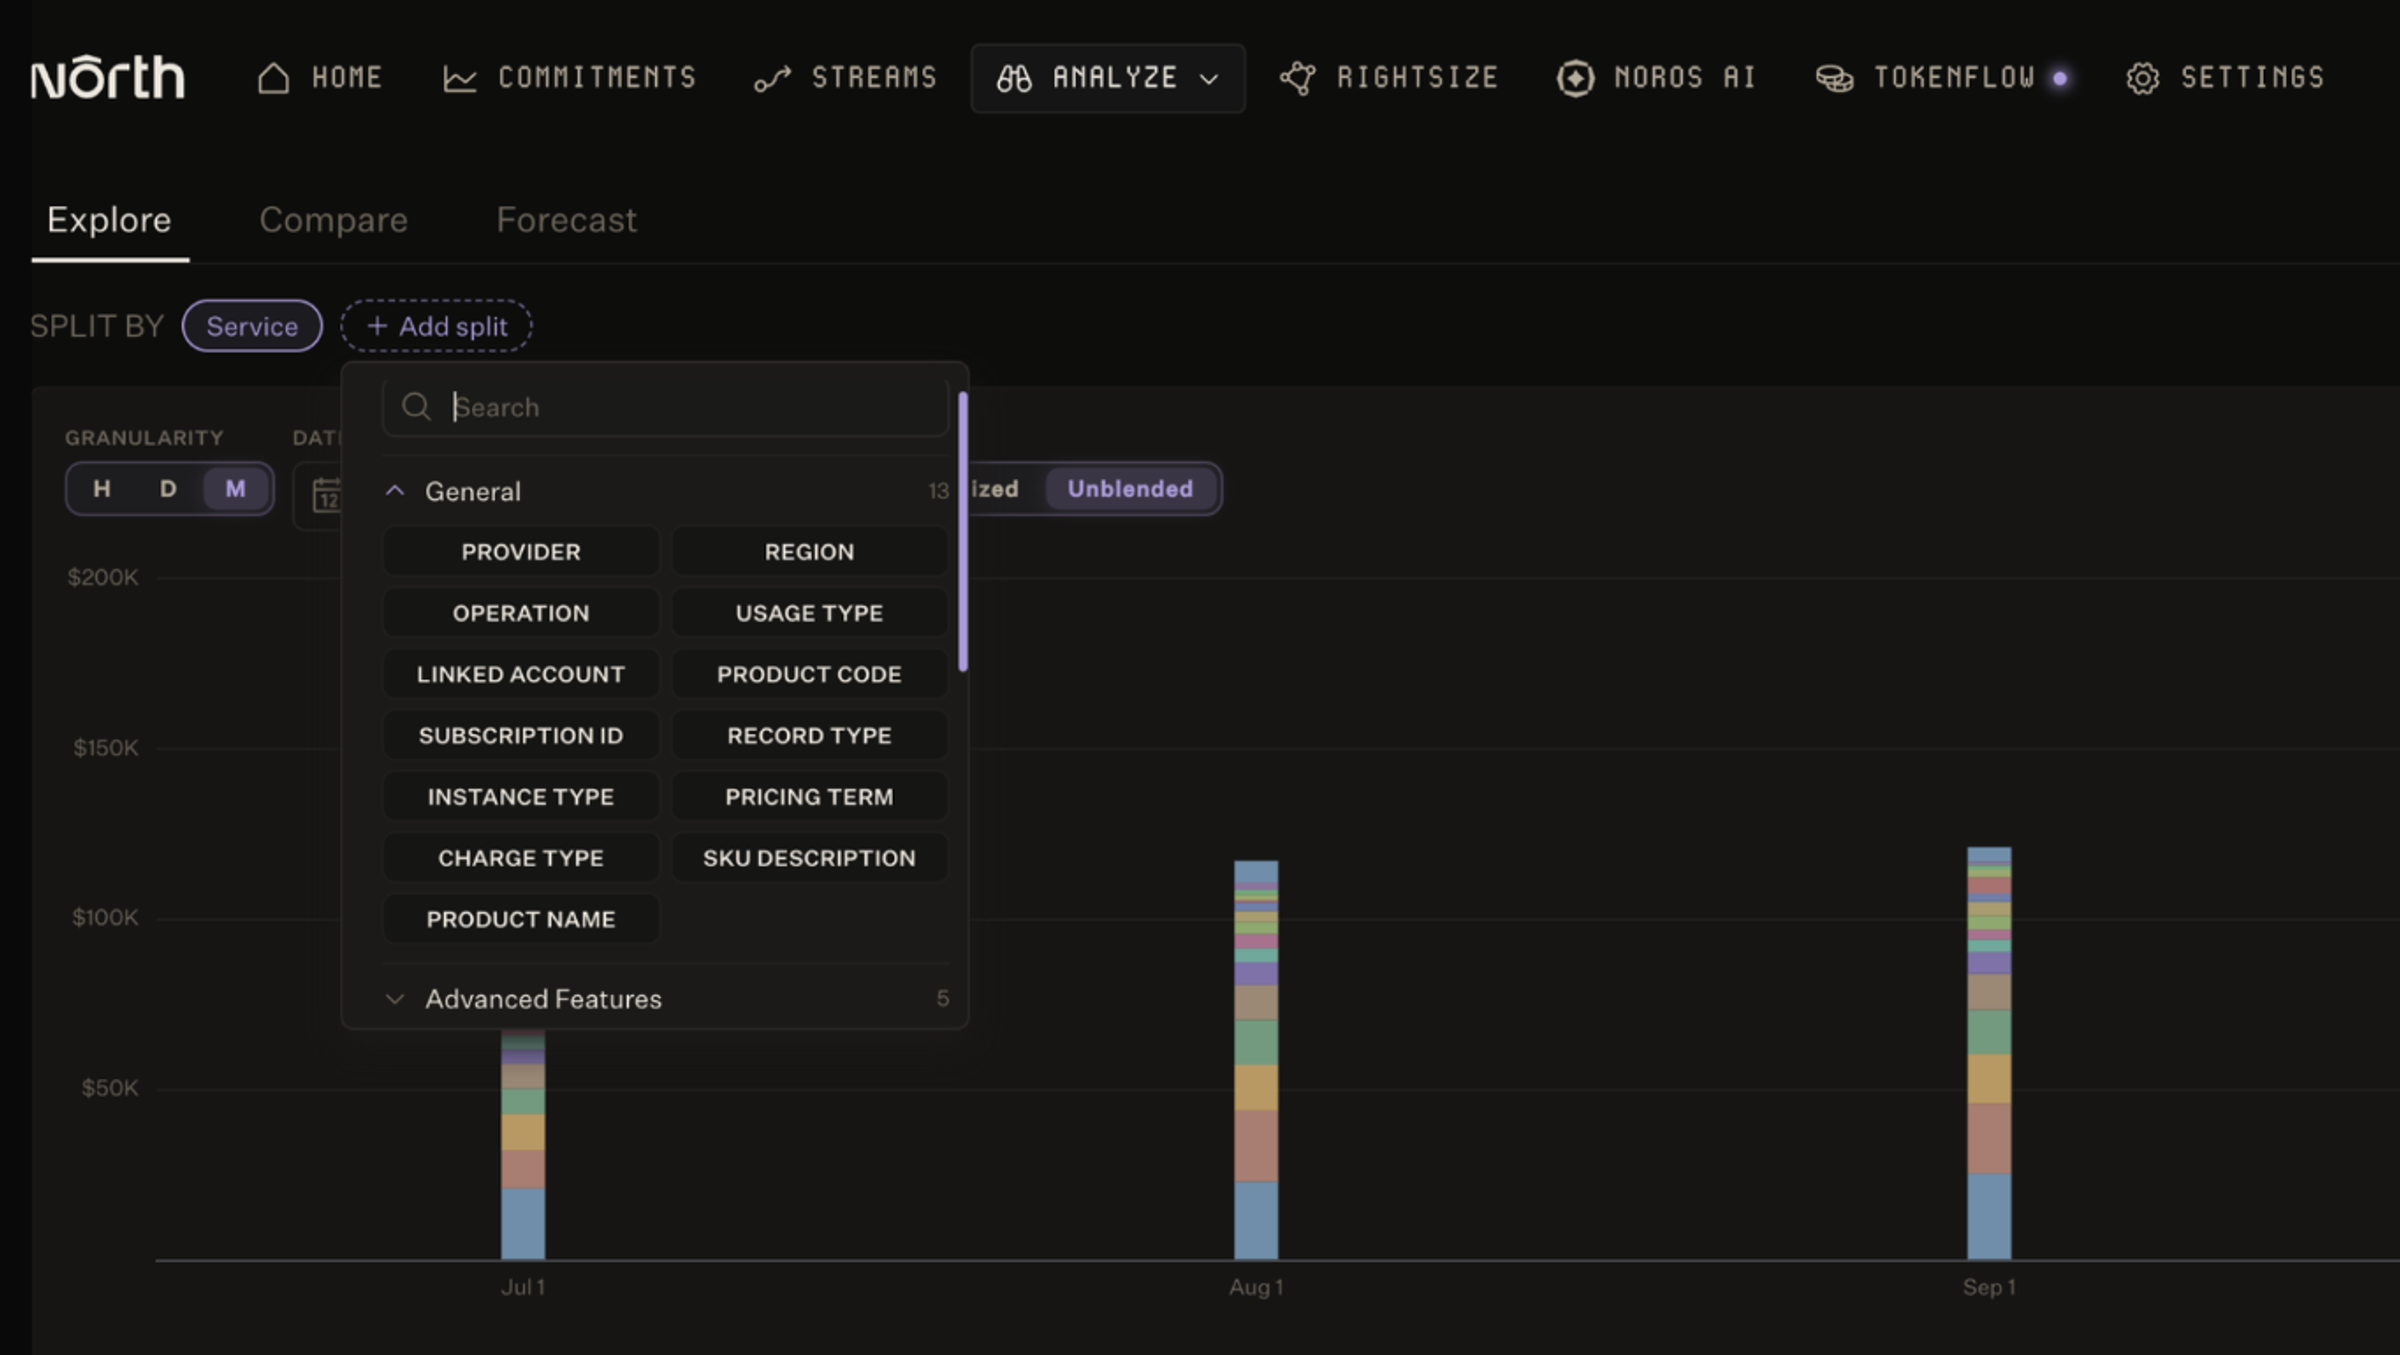
A cost per compute number is really several numbers at once: per team, per region, per machine type. Most of that detail isn't visible by default. A shift in the total only tells you that something changed.
North’s Analyze now provides that missing context. Customers can filter and split by over 90 dimensions, combining up to five in one view. Spend by linked account, service, region, team tag, and environment tag, all together. That context is what turns a single number into something you can actually act on.
Pinpoint exactly what's driving your cloud spend
Spotting a change in spend is the easy part. Knowing whether it's expected, and what's behind it, takes more digging.
With up to five dimensions in one view, you can find exactly which part of your cloud usage is driving a cost:
- Service and instance type, to see which machine types drive your compute cost
- Service and region, to see where a workload costs more to run than it should
- Team tag and environment tag, to compare production spend against staging
- Linked account and service, to see exactly which account is driving a cost
- Provider, to separate cloud spend from data and AI platform spend
That last split matters once your spend goes beyond cloud. With North's growing integrations library, Snowflake, Anthropic, OpenAI, and Datadog spend sits in the same view as your cloud spend. Split by provider first, then by the detail each one reports, to see whether a cost comes from compute, storage, or something else.
Every combination also works across time. Compare this month against last month to see whether a cost is new, growing, or normal for your environment. That comparison turns a single number into a trend worth flagging.
Noros, North's FinOps Agent, draws on that same detail. Ask about any of these combinations to understand whether what you're seeing is normal, or worth a closer look as a place to run leaner.
What's next
This update brings that context to where you already review spend. Nothing's buried in a provider bill or a separate tool, so decisions come easier. More ways to save, track, and build on that context are on the way.
If you're already a North customer, try this: pick a number you already know well, the one you check every week. Open it in Analyze, split by team tag and environment tag, and see if production or staging was driving it.
North's free tier already includes full visibility, with every dimension, at no cost. Get started to understand the answer behind every dollar you spend across cloud, data, and AI.