
A live view of your cloud spend.
Analyze breaks down spend, surfaces what changed, and projects what's next, without exporting data or building reports from scratch.

Clearer spend. Confident forecasts.
Turn complex cloud data into a clearer view of your past, present, and future spend.
Turn complex cloud data into a clearer view of your past, present, and future spend.
Slice spend any way you need
Break down cloud costs by service, team, region, or tag, and surface the biggest drivers without building a report.
Pinpoint what changed and why
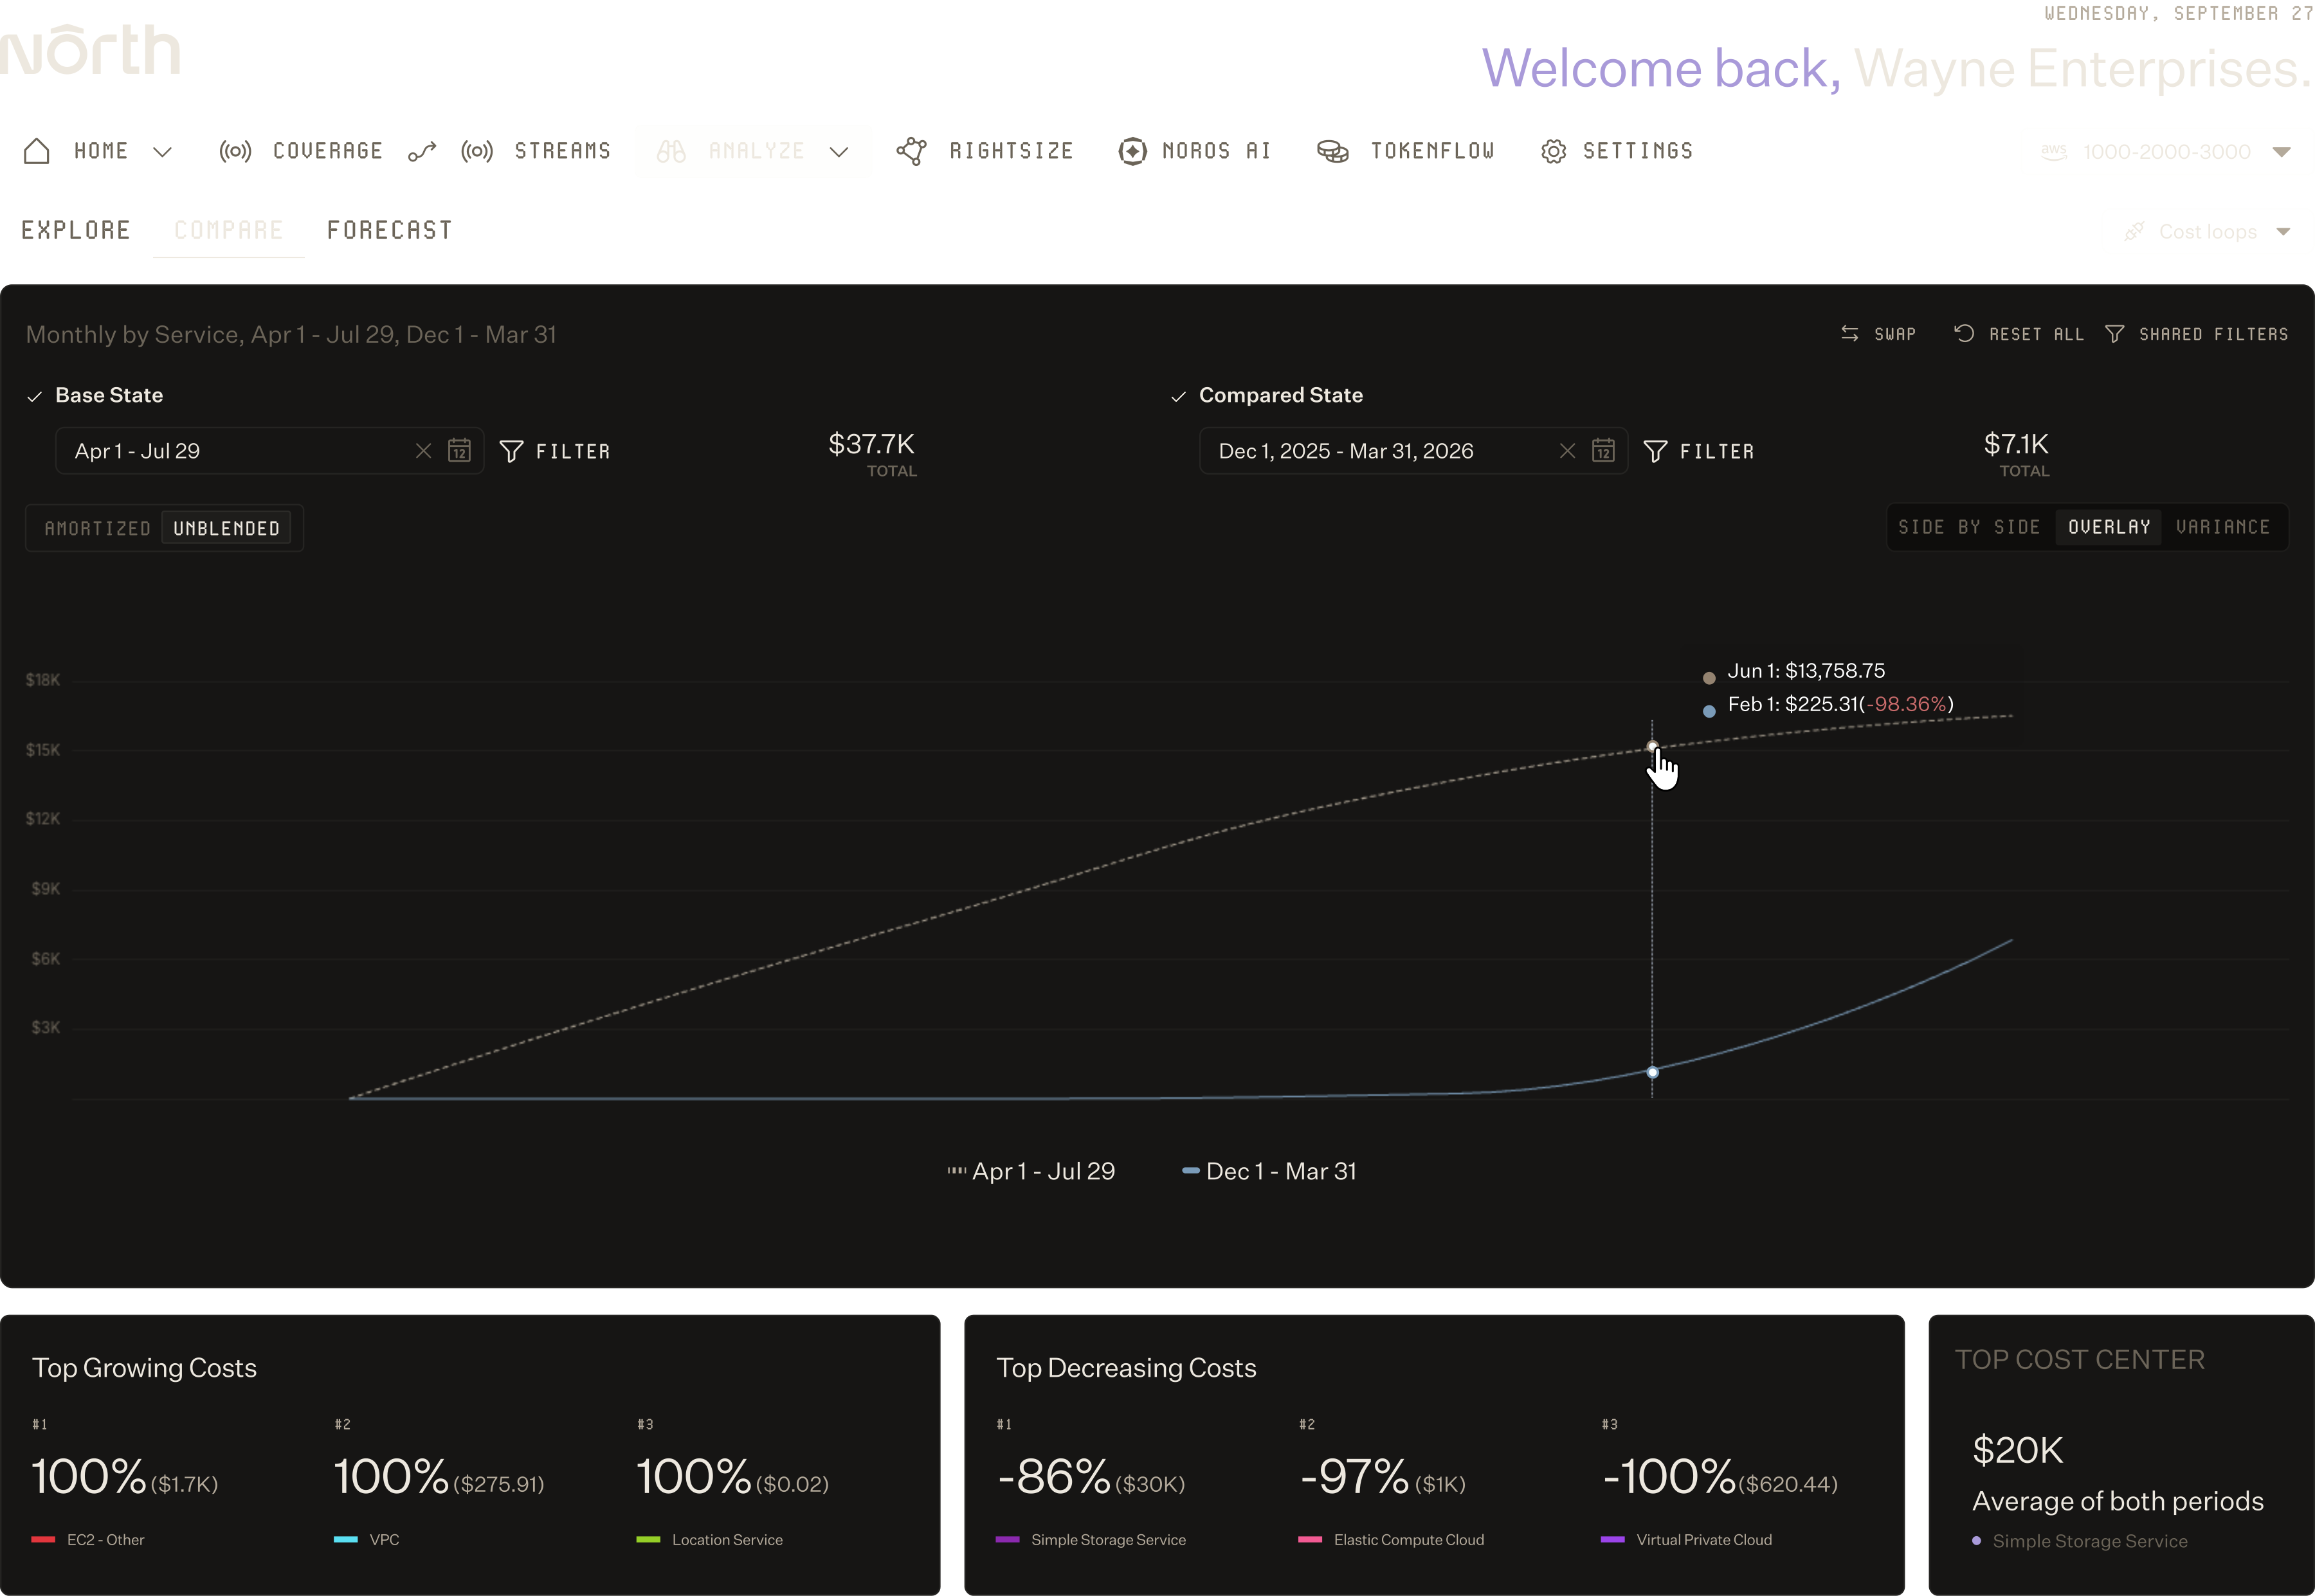
See exactly what changed between any two time periods, environments, or configurations, side by side.
See where costs are heading
Project future cloud spend on your real usage data, so budgeting and planning stay grounded in reality.
FT. 01
Ask better questions of your cloud cost data.
EXPLORE EVERY ANGLE OF SPEND.
Find the answer in seconds
Slice and filter cloud cost data on the fly, so anyone on the team can answer questions without exporting a CSV.
Catch what's growing fastest
Automated KPIs surface your largest spend areas and your fastest-growing groups, so cost drivers find you instead of the other way around.
Zoom from quarter to hour
Look at trends across months, then drop into a single day or hour to see exactly when something changed.
FT. 02
Understand what changed and why.
COMPARE AND SPOT THE SHIFT.
Track differences side by side
Set a base period and a comparison period and see the deltas instantly, with no manual math or spreadsheet stitching.
Compare more than just time
Compare environments, projects, or configurations against each other to see the full picture.
Surface the top movers automatically
See what increased the most, decreased the most, and drove the biggest overall change, in one view.
FT. 03
See where your cloud spend is heading.
FORECAST WITH CERTAINTY.
Predict spend based on history
Project future spend using machine learning trained on your historical data, not industry averages or static assumptions.
Plan on your terms
Set the time window, history depth, and projection range to match how your team budgets, plans, and reports.
Carry context into every forecast
Filters and groupings move with you across Explore, Compare, and Forecast, so projections reflect the same view you just analyzed.
Cloud cost clarity, backed by customers.

North took 5 minutes to setup and showed me we could save 40%. To this day, it's the fastest & clearest demo of ROI I have ever seen in business.”
North is helping us get the right reservations and savings plans in place as we stabilize our infrastructure. And down the line, we’ll look at extending this strategy even further.”
The flexibility and ease of integration really stood out. If someone told me from the start it would be this easy to try, use, and save, I wouldn’t have believed them. But it is. And the savings are real.”

See your cloud spend live.
Start using North's Analyze capabilities today.
FAQs
Find answers to commonly asked questions about Analyze.
What is Analyze?
Analyze is North's live cloud cost visibility tool. It breaks down your cloud spend by service, team, region, or tag, and shows you what changed, why it changed, and where costs are heading next. Unlike traditional reporting, Analyze works in real time—no exporting data, building spreadsheets, or waiting for reports. Get answers in seconds.
How quickly can I find answers in my cloud cost data?
Instantly. Slice and filter your cloud costs on the fly by any dimension—service, region, tag, team, environment. Analyze automatically surfaces your largest spend areas and fastest-growing cost groups, so you don't have to hunt for what matters. Drop from quarterly trends down to hourly detail to see exactly when something changed, all without leaving the app.
Can I see what's changed between time periods?
Yes. Use the Compare tab to set any two time periods side by side and see the deltas instantly—no manual math or spreadsheet work. You can also compare different environments, projects, or configurations against each other, not just dates. Analyze shows you what increased the most, decreased the most, and drove the biggest overall change in one view.
How detailed can I get with the data?
Very. View your costs at any granularity—by month, day, or even by hour. This means you can start with quarterly trends to spot big shifts, then drill down to a specific hour to see exactly when and where a cost spike happened. You can also filter and group by multiple attributes at once to isolate specific cost drivers.
How do I forecast my future cloud spend?
Analyze uses machine learning trained on your actual historical usage data to project future spend, not industry averages or guesses. You can set the lookback period (how much history to learn from) and projection range (how many days to forecast) to match how your team budgets and plans. Forecasts automatically reflect the same filters and groupings you were just analyzing.
Can I share insights with my team without exporting data?
Yes. Export results directly from Analyze as needed, but most analysis happens live in the app. Your filters and groupings sync across all views, so when you're comparing periods or forecasting, you're always looking at the same definition of costs. Share findings with your team through links or PDFs without the overhead of building reports manually.