Ask and get metrics, charts, and tables in one view.

Every cloud cost view your team needs, built from a single prompt
Ask a question, get a full dashboard. North builds, filters, refreshes, and shares custom cloud cost views from natural language, so finance and engineering teams can stop waiting on data analysts to see what they need.
FT. 01
North
Generative Dashboards
Reporting that keeps up with the FinOps questions you ask
Reporting that keeps up with you
01
01
Zero
data engineers required (ask in plain English, get the view)
02
02
One tool
for every cloud cost view (no separate BI build required)
03
03
Minutes
not sprints (go from question to dashboard No tickets)

Skip the dashboard backlog.
Reporting in cloud cost tools is usually one of two things: a static graph the vendor decided you needed, or a chat answer that disappears the moment you close the window. Neither scales. Generative dashboards combine the speed of chat with the persistence of a real reporting surface, so the cloud cost views you build stay live, stay filterable, and stay shareable across your team.
0.01
Use Cases
One dashboard, one prompt
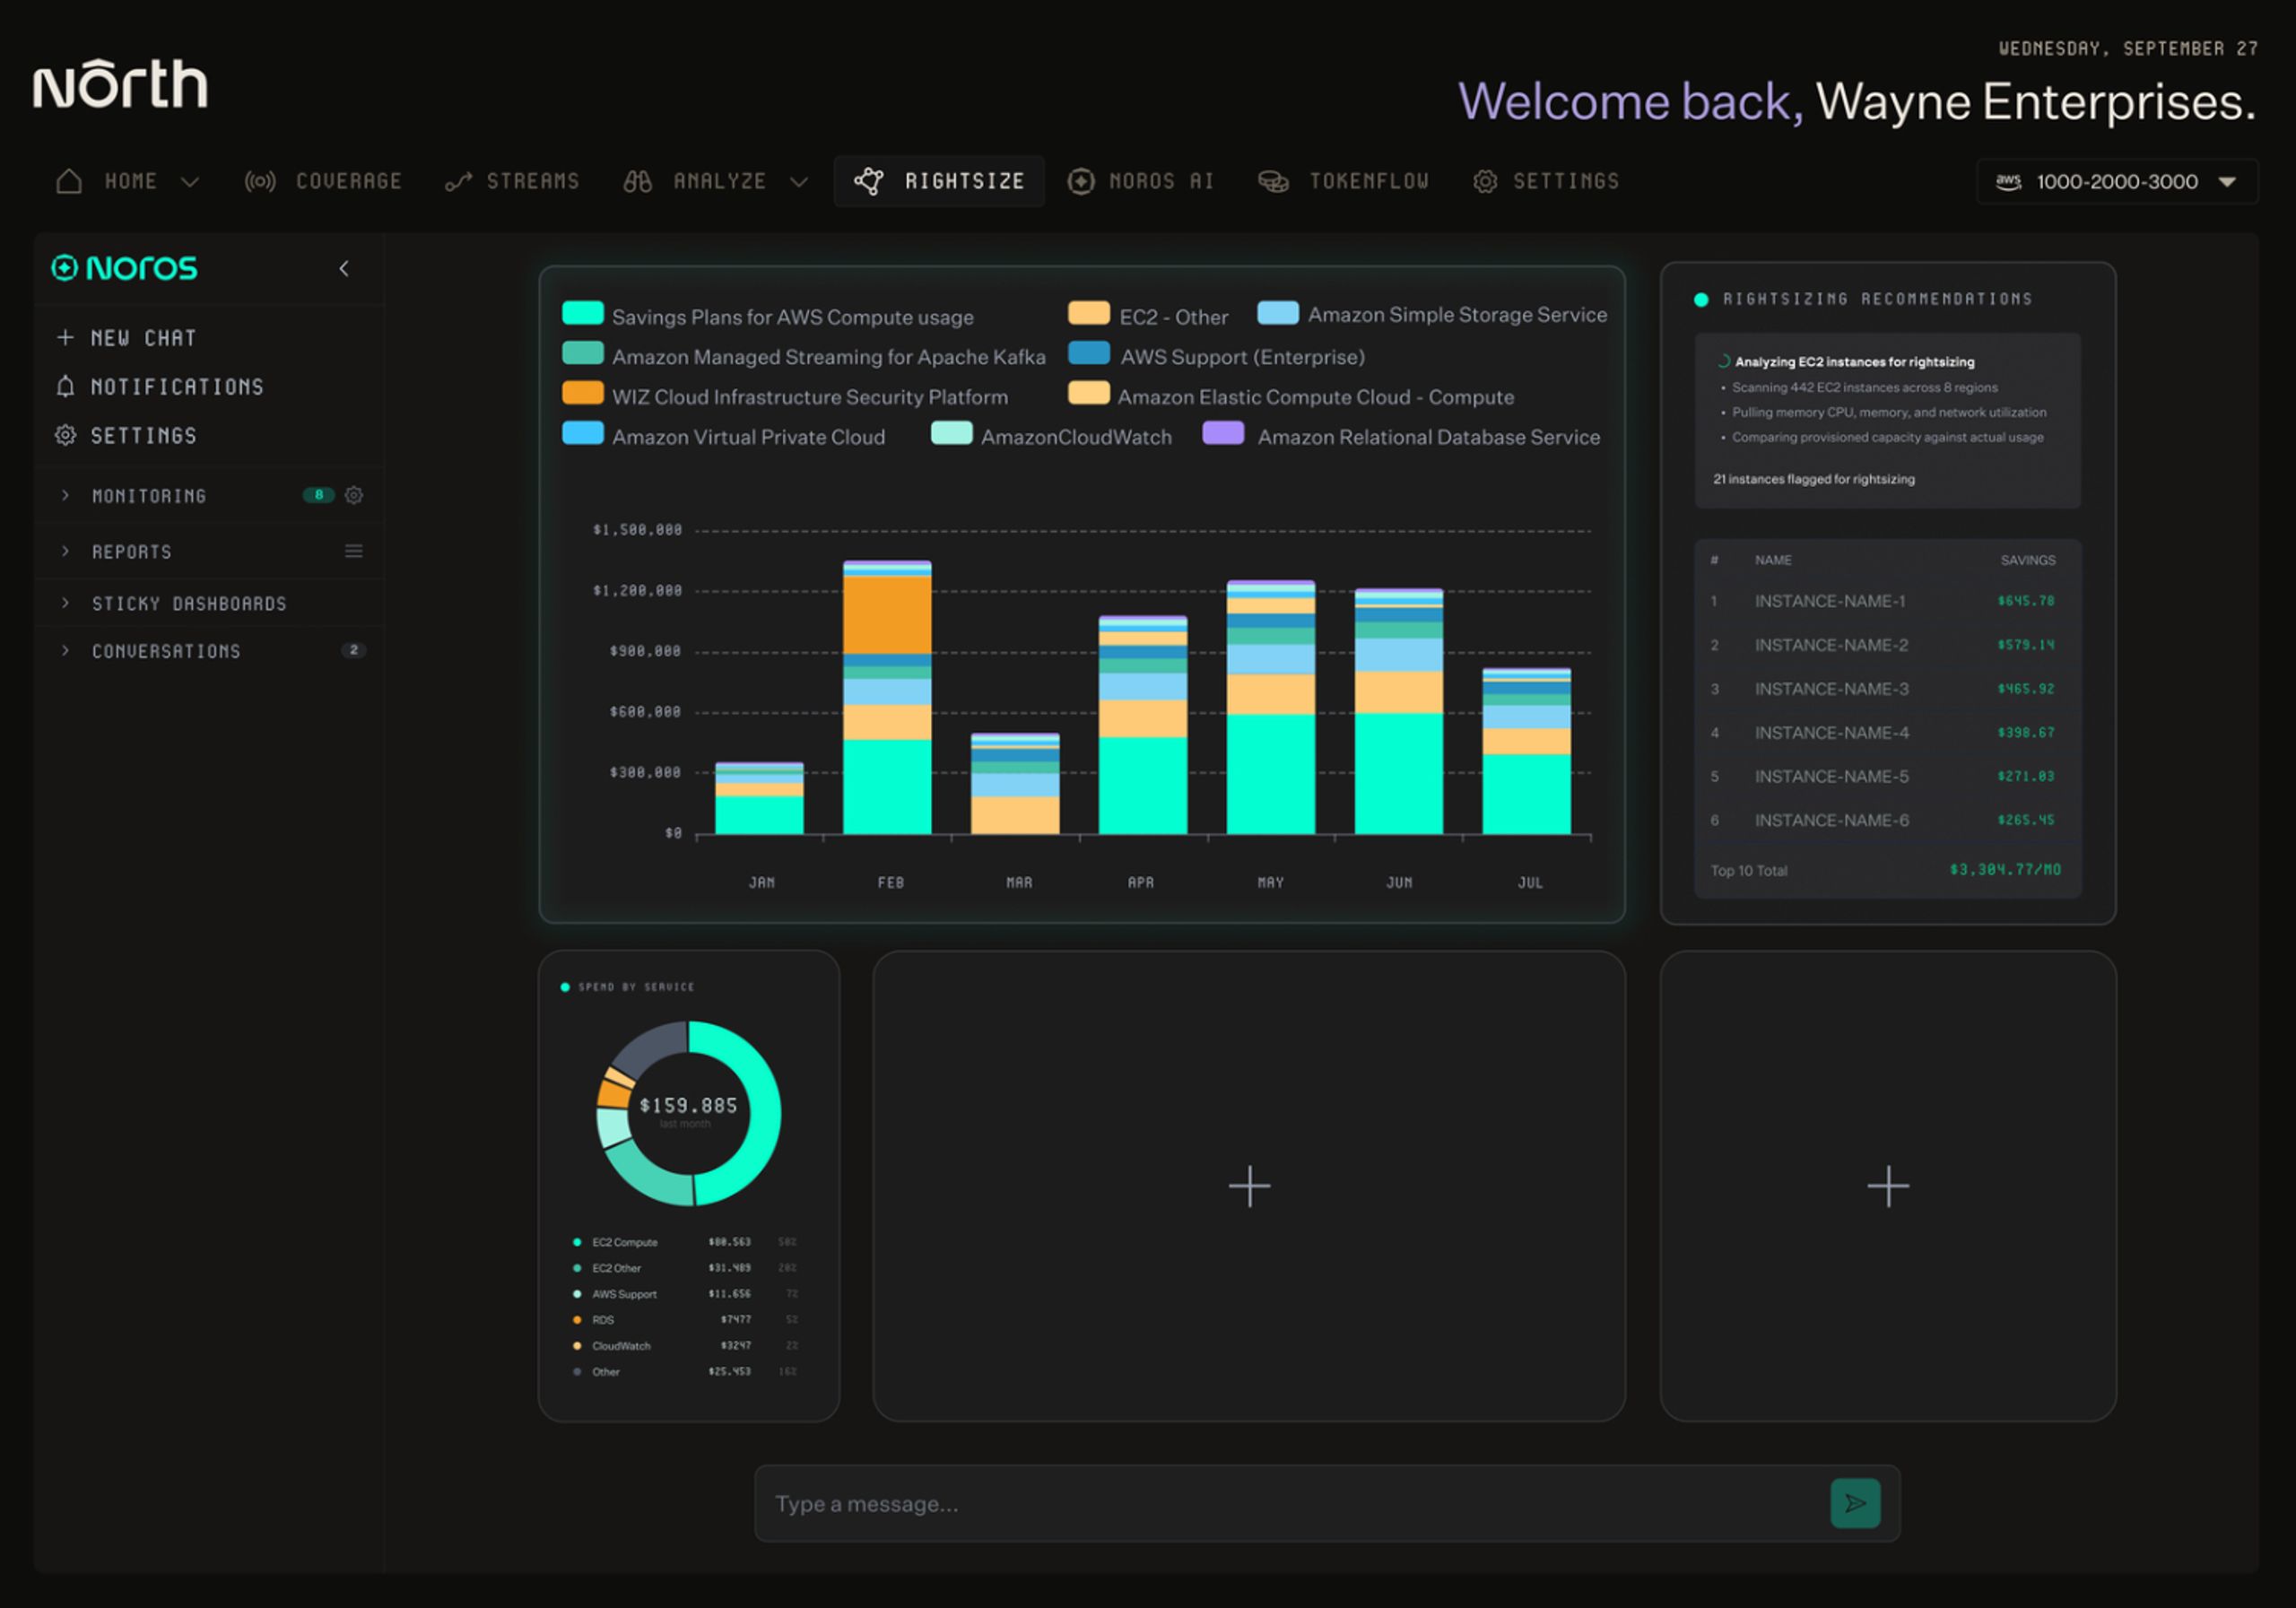
Build a full dashboard from a single prompt.
Ask North for a state of your account and get a complete reporting view built in one pass. Generative dashboards assemble metrics, area charts, bar charts, line charts, tables, and text widgets into a single layout you can edit, filter, and reuse.
01
Ask in plain English
02
One dashboard
Every widget type lives in one dashboard, not scattered across separate reports.
03
Keep editing
Keep editing after it builds, so one prompt becomes a reusable view.
0.02
Use Cases
Live, or pinned, your call
Keep your views live, or pin them in time.
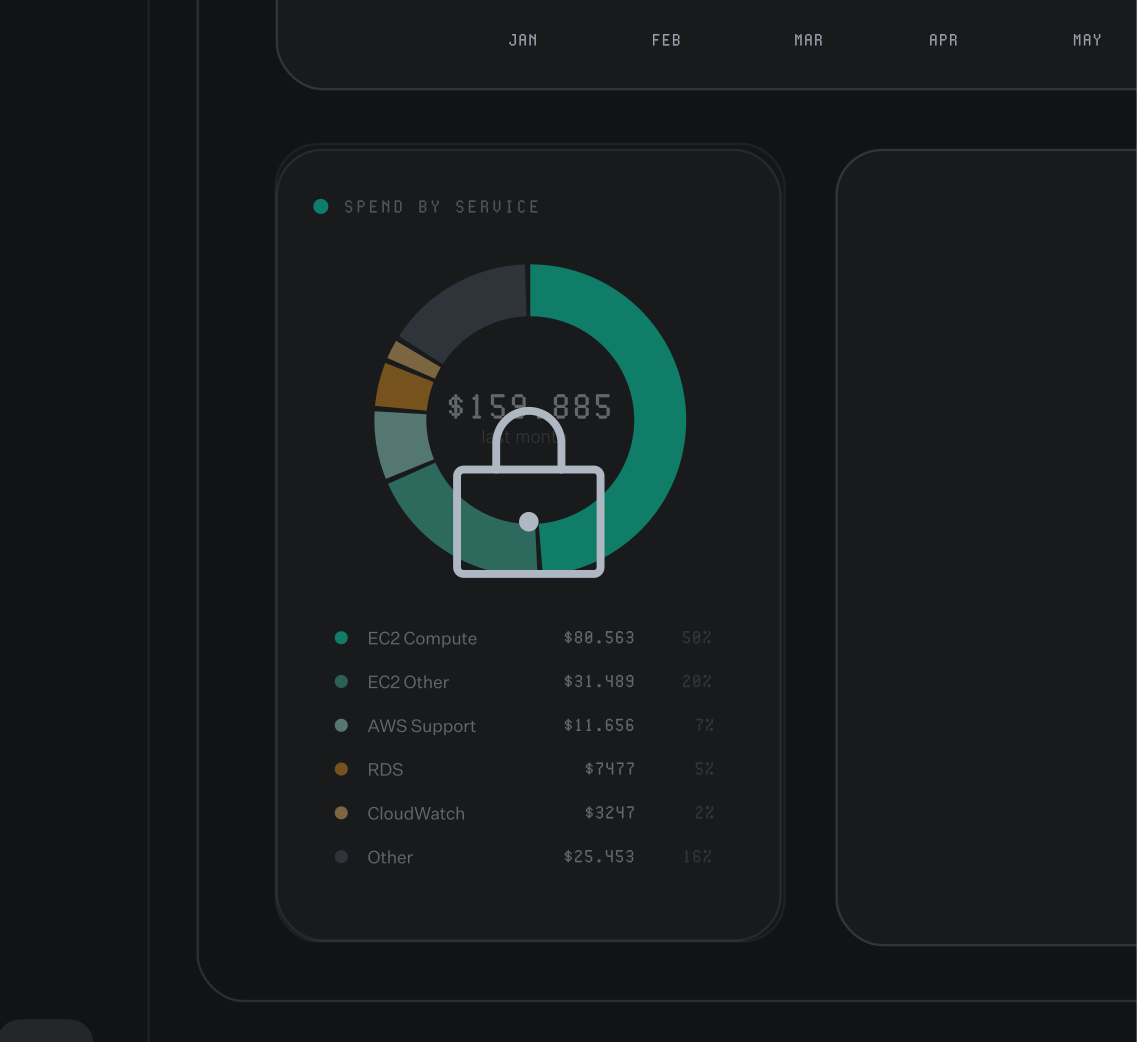
Choose how each dashboard behaves. Set a view to refresh on a schedule for ongoing monitoring, or pin a snapshot to lock in a point-in-time report. Filter by date range, account, service, team, or any dimension North already tracks for you.
01
On your schedule
Schedule refreshes daily, weekly, or on demand.
02
Frozen snapshots
Freeze a view for monthly close, board decks, or audits.
03
Slice by dimension
Filter each widget on its own, down to specific tags.
0.03
COMING SOON
Seatless sharing Beta
Share reporting without sharing logins.
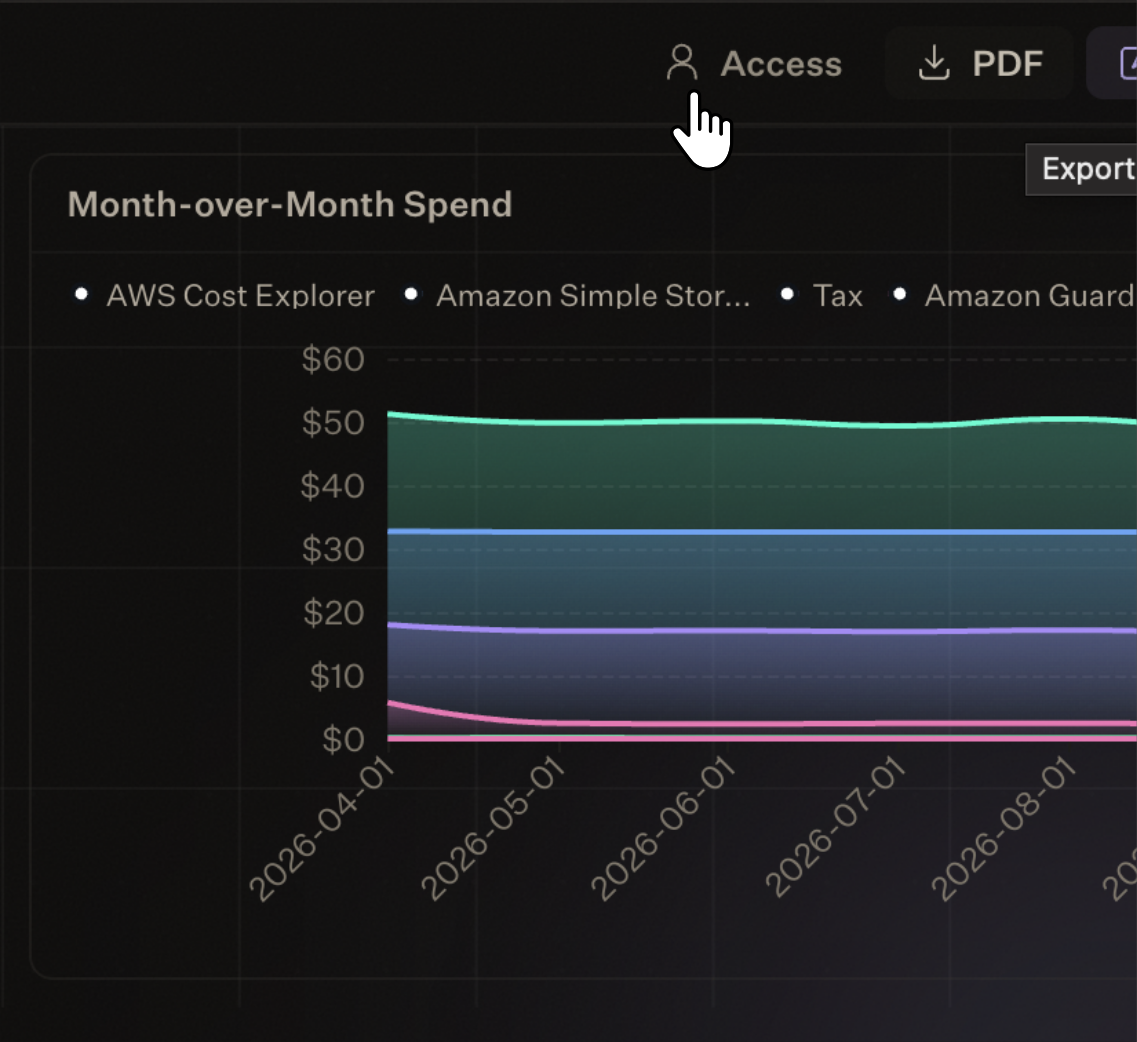
Send a dashboard to a finance lead, a board member, or a partner team without provisioning seats. Generative dashboards support time-limited links, email-restricted access, and PDF exports, so the right people see the right view without an account.
01
Expiring links
Share dashboards with expiring or email-restricted links.
02
PDF export
Export to PDF for offline reporting.
03
Chosen cadence
Schedule recurring reports straight to your inbox.
One surface, every team
For Engineering
Build a live control tower across every account you manage, refreshed automatically. Catch drift, monitor commitment coverage, and pull rightsizing candidates into a single live dashboard.
For Finance
Pin a monthly snapshot of spend, anomalies, and savings actions for your board deck. Compare last month to this month, slice by business unit, and export to PDF when the report is ready.
Their Savings Their Words

Just try it, it's easy to adopt and the value is immediate. You will regret not using it sooner.”
North took 5 minutes to setup and showed me we could save 40%. To this day, it's the fastest & clearest demo of ROI I have ever seen in business.”
The flexibility and ease of integration really stood out. If someone told me from the start it would be this easy to try, use, and save, I wouldn’t have believed them. But it is. And the savings are real.”

Build your first dashboard in minutes
FAQs
Frequently asked questions about Generative Dashboards.
What can you build with North's Generative Dashboards?
A full cloud cost dashboard or a single widget, built from a plain-English question. For example, ask for a breakdown of AWS, GCP, and Azure spend by service, a trend line on this month's anomalies, or a table of commitment coverage by account. Mix metrics, charts, tables, and text notes in one view, then refresh it on a schedule or pin a snapshot to lock in a point in time. No data analyst or BI ticket required, so your team sees the answer in minutes instead of waiting on a sprint.
Can I ask AI to turn my cloud billing data into charts and reports?
North's generative dashboards run on Noros, North's AI agent, and turn a plain-English request into a live chart, table, or number. Describe what you want, and Noros builds that widget and adds it to your dashboard. Ask for AWS, GCP, or Azure spend by service, for example, and get a live chart, not a one-time export. Each widget keeps itself current, so you never have to ask the same question twice.
What cloud providers does North's Generative Dashboards support?
How current is the data on North's Generative Dashboards?
Each widget refreshes automatically, at most every 12 hours. Take a widget built for "this month," for example. It rolls forward on its own as the month changes, no rebuild needed. You always see current numbers, without asking the same question twice.
Can I filter a North dashboard by tag?
Each widget filters independently, down to specific tags. Scope one widget to engineering's tagged spend while another stays at the whole-account level, in the same dashboard. Different teams read their own slice of the same report, no separate exports required.