-
19 min read
10 best cloud cost management tools in 2026

TL;DR
- As spend, teams, and infrastructure grow, cloud costs outpace the native tools built to track them.
- Native dashboards work well for basic visibility, budgets, and early cost reviews.
- Dedicated platforms become more valuable when commitments, shared costs, and multi-cloud reporting require ongoing work.
- The right tool should match your spend, provider mix, workflows, and available engineering time.
- North.cloud brings cloud, AI, and data costs into one system, with commitment management, allocation, anomaly detection, rightsizing, and plain-language analysis through Noros AI.
Cloud overspending rarely comes from one major decision. Rather, costs usually rise through smaller changes that accumulate over time.
Maybe it's a development environment nobody remembered to shut down, or data transfer that quietly crept up, or a commitment that expired and never got replaced. None of it looks like much on its own, but it adds up fast on the bill.
As infrastructure expands, reviewing every cost change manually becomes difficult. From years of working with teams looking to automate their cloud costs, we’ve found that the right cloud cost management tool depends on three factors:
- Monthly cloud spend
- Infrastructure complexity
- Available engineering and finance capacity
Simple environments may only need native billing dashboards and budget alerts. More complex teams often need commitment automation, cost allocation, anomaly detection, and cross-cloud reporting.
This guide explains when those needs change and compares ten cloud cost management tools in 2026.
Why cloud cost management gets harder at scale
Cloud cost management becomes more difficult as providers, services, and owners multiply.
A mature environment may span Amazon Web Services (AWS), Google Cloud Platform (GCP), and Microsoft Azure. It may also include Kubernetes, graphics processing units, artificial intelligence services, and data platforms with separate billing models.
The challenge is no longer basic visibility. Teams now need to understand how spend changes, who owns it, and which actions should happen next.
Three shifts usually create that pressure:
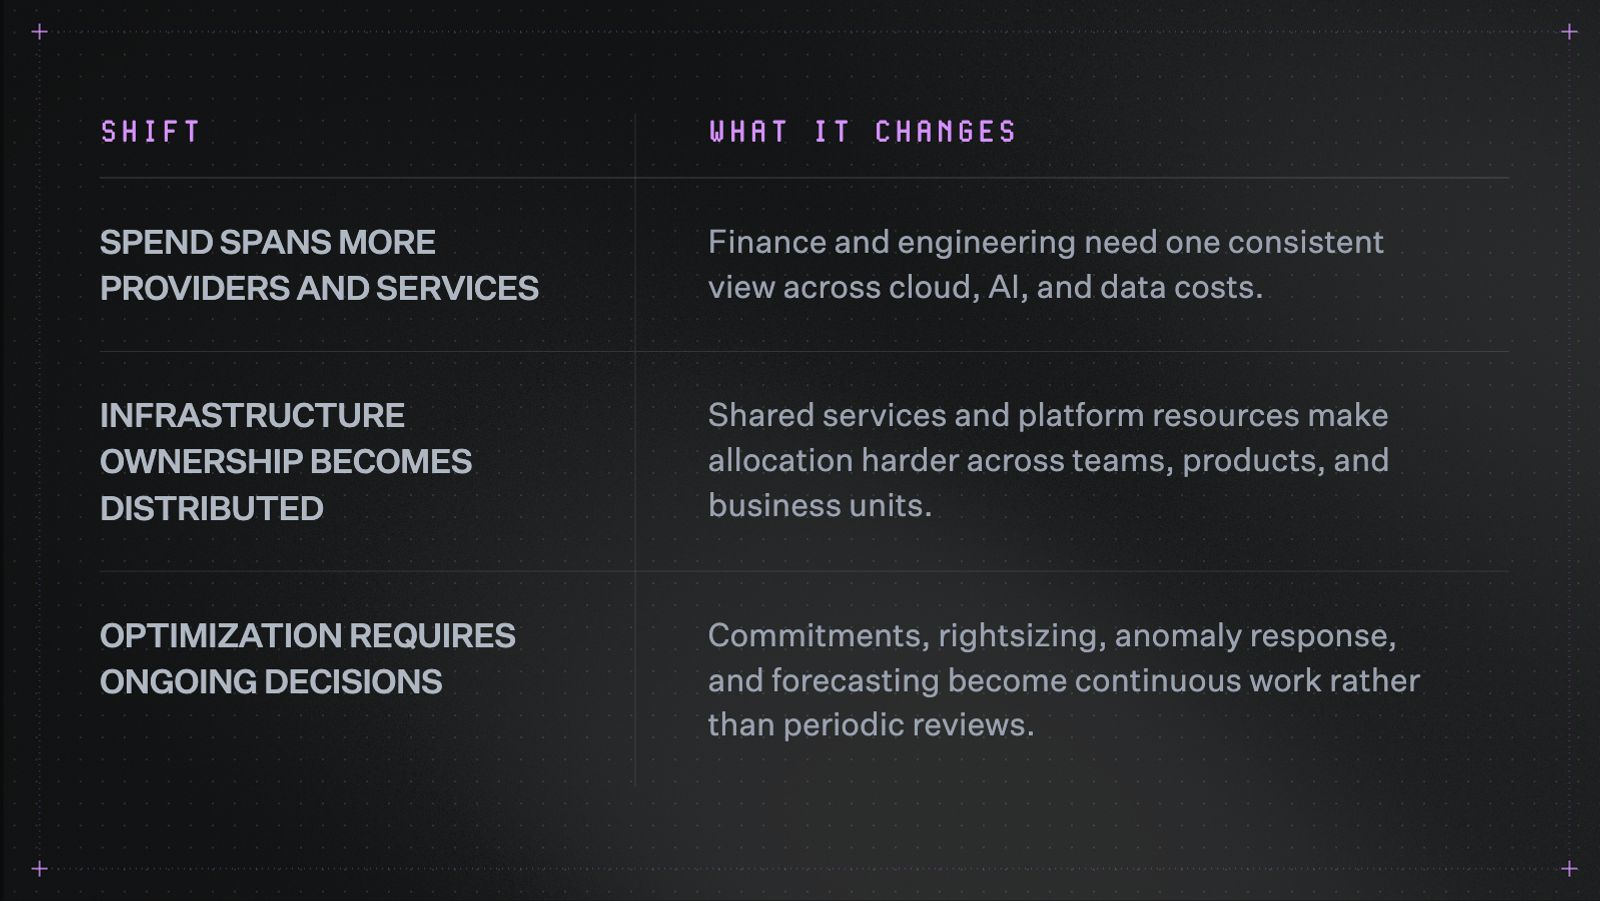
Three shifts are changing what cloud cost management tools need to handle, from a single consistent view to allocation across teams to decisions that never really stop.
Native provider tools still offer useful billing data. However, they rarely create one operating model across providers, teams, and cost categories.
As complexity increases, companies need stronger allocation, automation, and shared reporting.
How to choose a cloud cost management tool
The right tool depends on your cloud operating model, not spend alone.
A single-cloud environment may need stronger reporting and commitment planning. A multi-cloud organization may need one system of record, automated optimization, and business-level allocation.
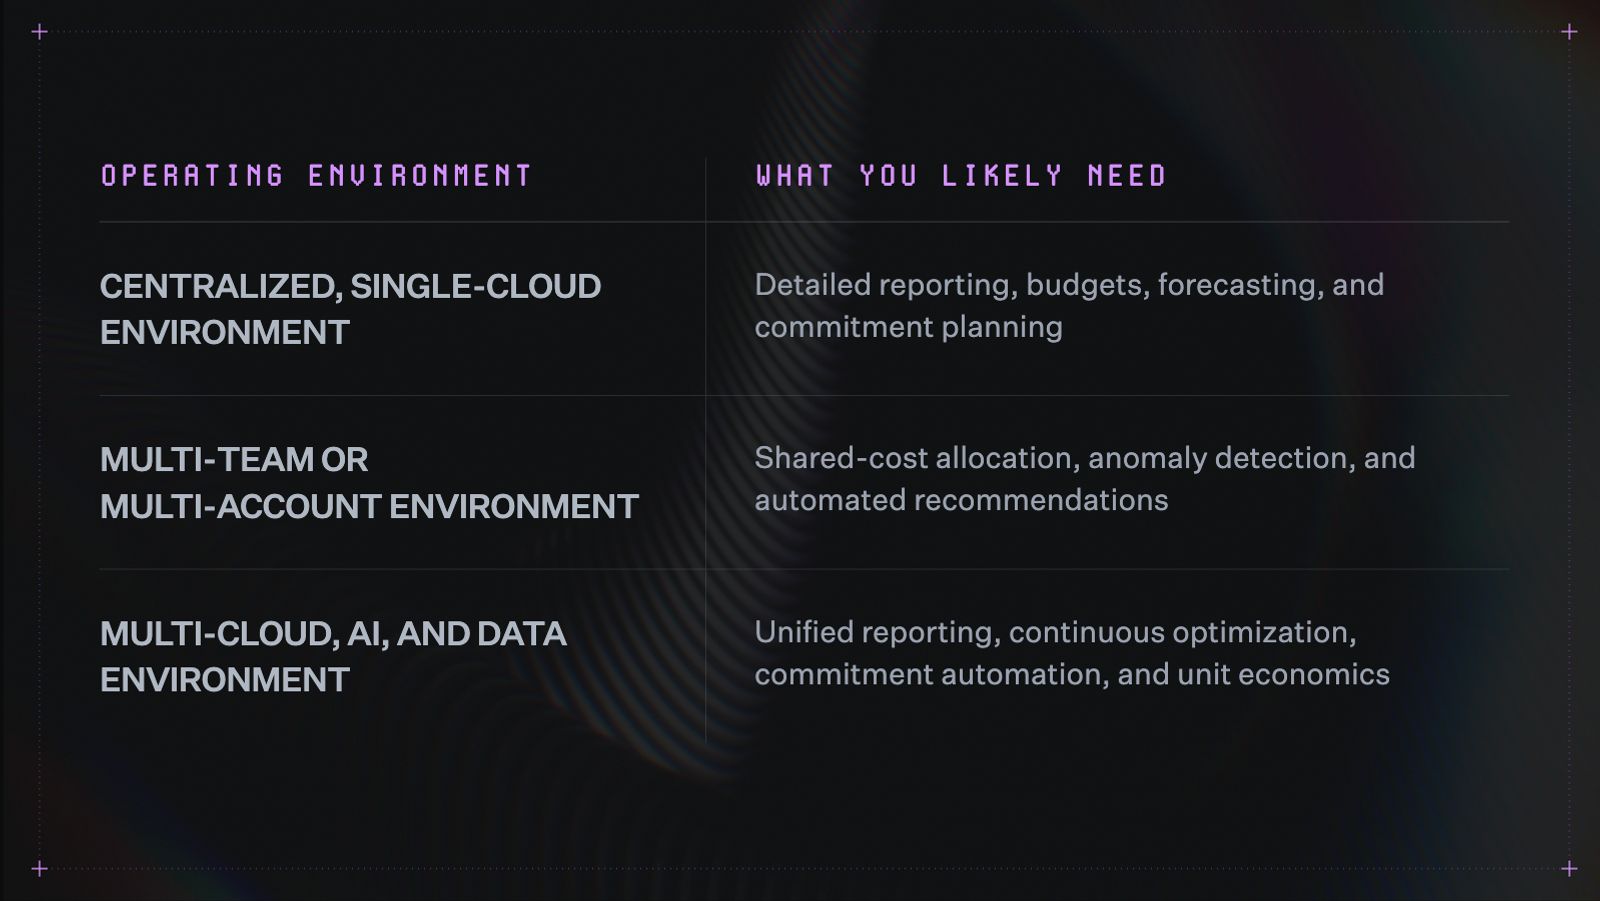
What you need from a cloud cost tool depends on your environment, from a single cloud to a sprawling mix of clouds, AI, and data.
These categories aren't fixed. A small team running several providers can outgrow basic tooling fast, while a bigger, steadier environment might not need much automation at all.
Five questions to ask before choosing
1. Does it act on the data?
Visibility only tells you what already happened. The tools worth paying for go further, capturing savings and cutting down repeated manual work.
Some platforms stop at recommendations. Others can automate commitments, rightsizing, help with forecasting and other approved actions on their own, so find out which one you're actually getting.
2. Can it support changing usage?
Infrastructure rarely sits still. New services launch, workloads shift, and your provider mix changes more than you'd think.
A good tool keeps up, adjusting forecasts, commitment coverage, and recommendations as usage evolves instead of falling behind it.
3. Does it create one system of record?
Nothing slows a team down faster than engineering and finance working off two different numbers.
Look for a platform that gives both sides one system of record, consistent reporting across providers, accounts, teams, AI services, and data platforms, so nobody's stuck reconciling spreadsheets before they can even start solving the real problems.
4. Does it fit existing workflows?
Even a strong insight loses its value if nobody sees it in time to act.
Alerts, reports, and recommendations should land in Slack, Jira, or wherever your team already works. That's what actually reduces operational work, a new dashboard to check every morning does the opposite.
5. Is the pricing easy to evaluate?
Weigh the cost against the savings, time, and operational work the platform actually removes. Pricing should be transparent and posted publicly, not something you have to request.
Pay attention to how costs scale with spend, usage, or resources, and whether the vendor is asking for a long-term contract to get there.
The best cloud cost management tools in 2026
Cloud cost tools solve different parts of the problem. Some focus on native visibility, while others specialize in Kubernetes, allocation, rightsizing, or commitment automation.
The ten options below cover those major categories.
1. North.cloud: Cloud, AI, and data cost management in one place
North is the financial operating system for cloud, AI, and data spend. It helps teams understand costs, identify changes, automate savings, and connect spend to the business.
The platform supports AWS, GCP, and Azure. North also integrates natively with other platforms, bringing in spend from OpenAI, Anthropic, and Snowflake alongside cloud costs, with more integrations to come.
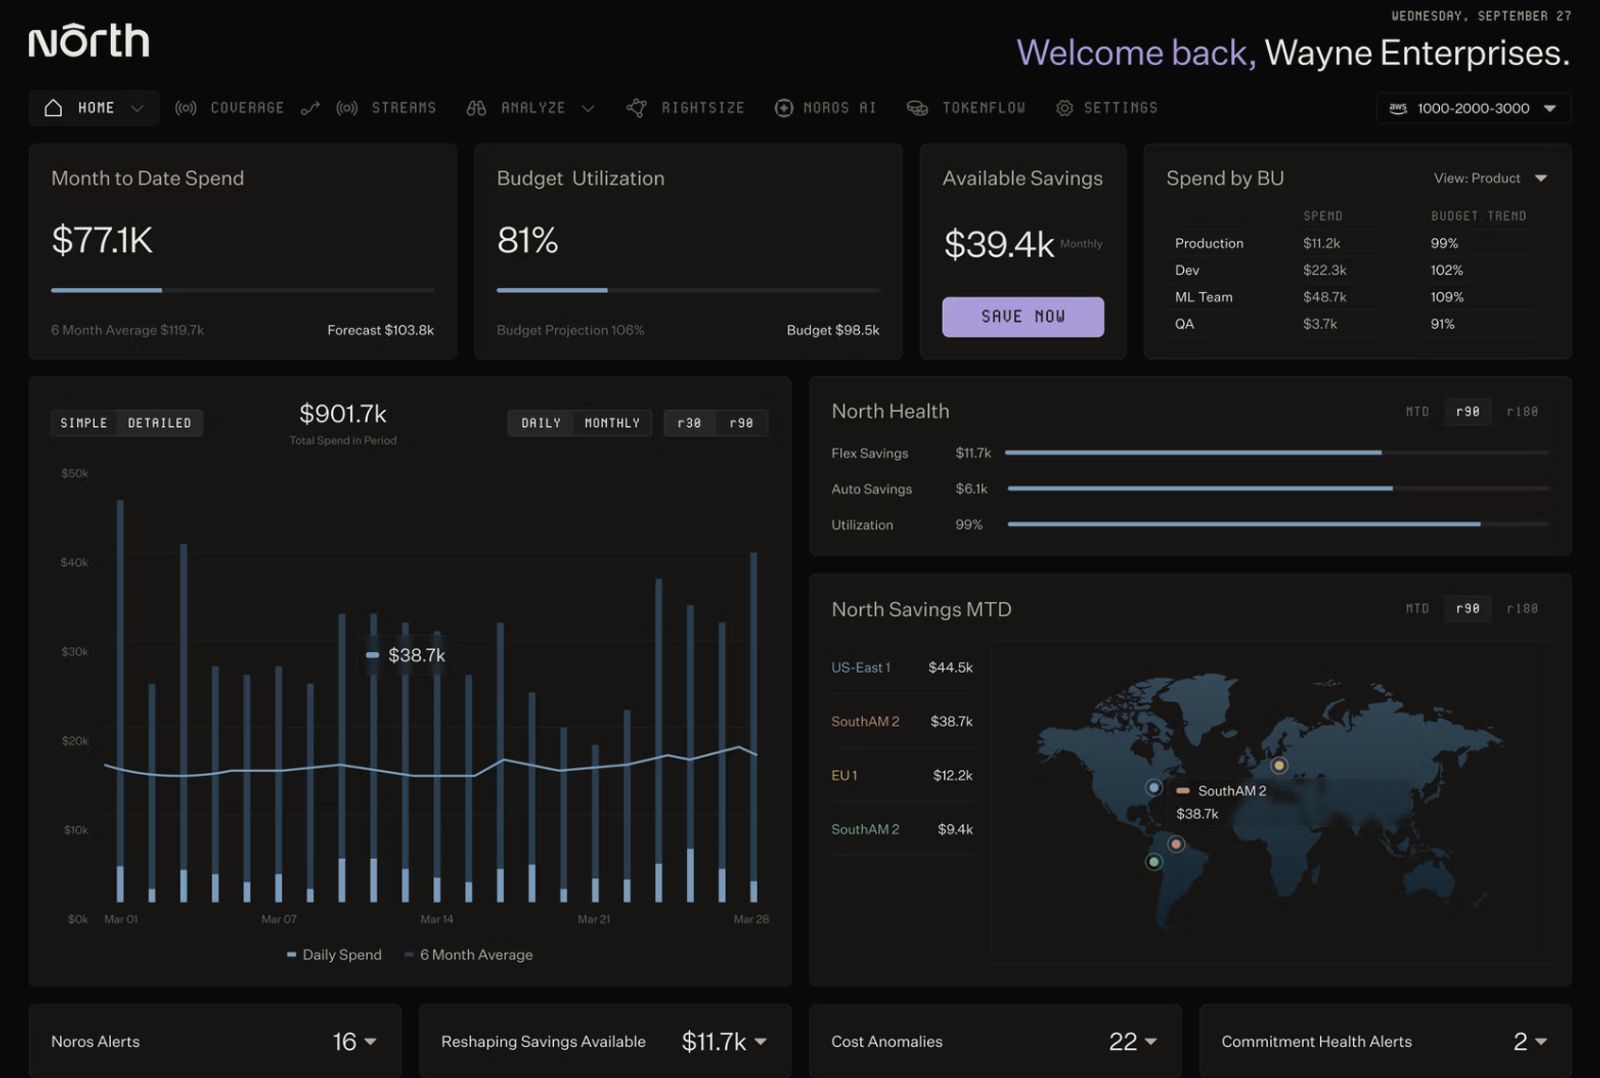
North's dashboard surfacing month-to-date spend, savings, and anomaly alerts across business units and regions in a single view.
Best for: Teams that have outgrown native billing tools and want broader cost control without adding more manual FinOps work.
Pricing:
- Free tier: $0/month. Full visibility with Analyze, Coststreams, Anomalies, Rightsize, GreenOps, and visibility within Coverage.
- Starter: $199/month, for teams managing up to $75K/month in cloud spend. Adds Autobot (3.5% fee on commitment cost) and Flexbot (25% fee on savings).
- Premier: $1,399/month, for teams managing $75K/month or more in cloud spend. Lowers Autobot fees to 1.5% and Flexbot to 20%, with unlimited Coststreams views and business units.
- Premier Plus: Custom annual plan, suggested for teams managing $1M/month or more in cloud spend.
See the North.cloud pricing page for full plan details.
One system across the FinOps lifecycle
Many companies add cost tooling one problem at a time. One platform handles commitments, another tracks anomalies, a third allocates shared spend, and reporting is left scattered across all of them.
That approach can work for a while, but it creates more systems to manage. It also leaves gaps between tools, especially when finance and engineering need the same answer.
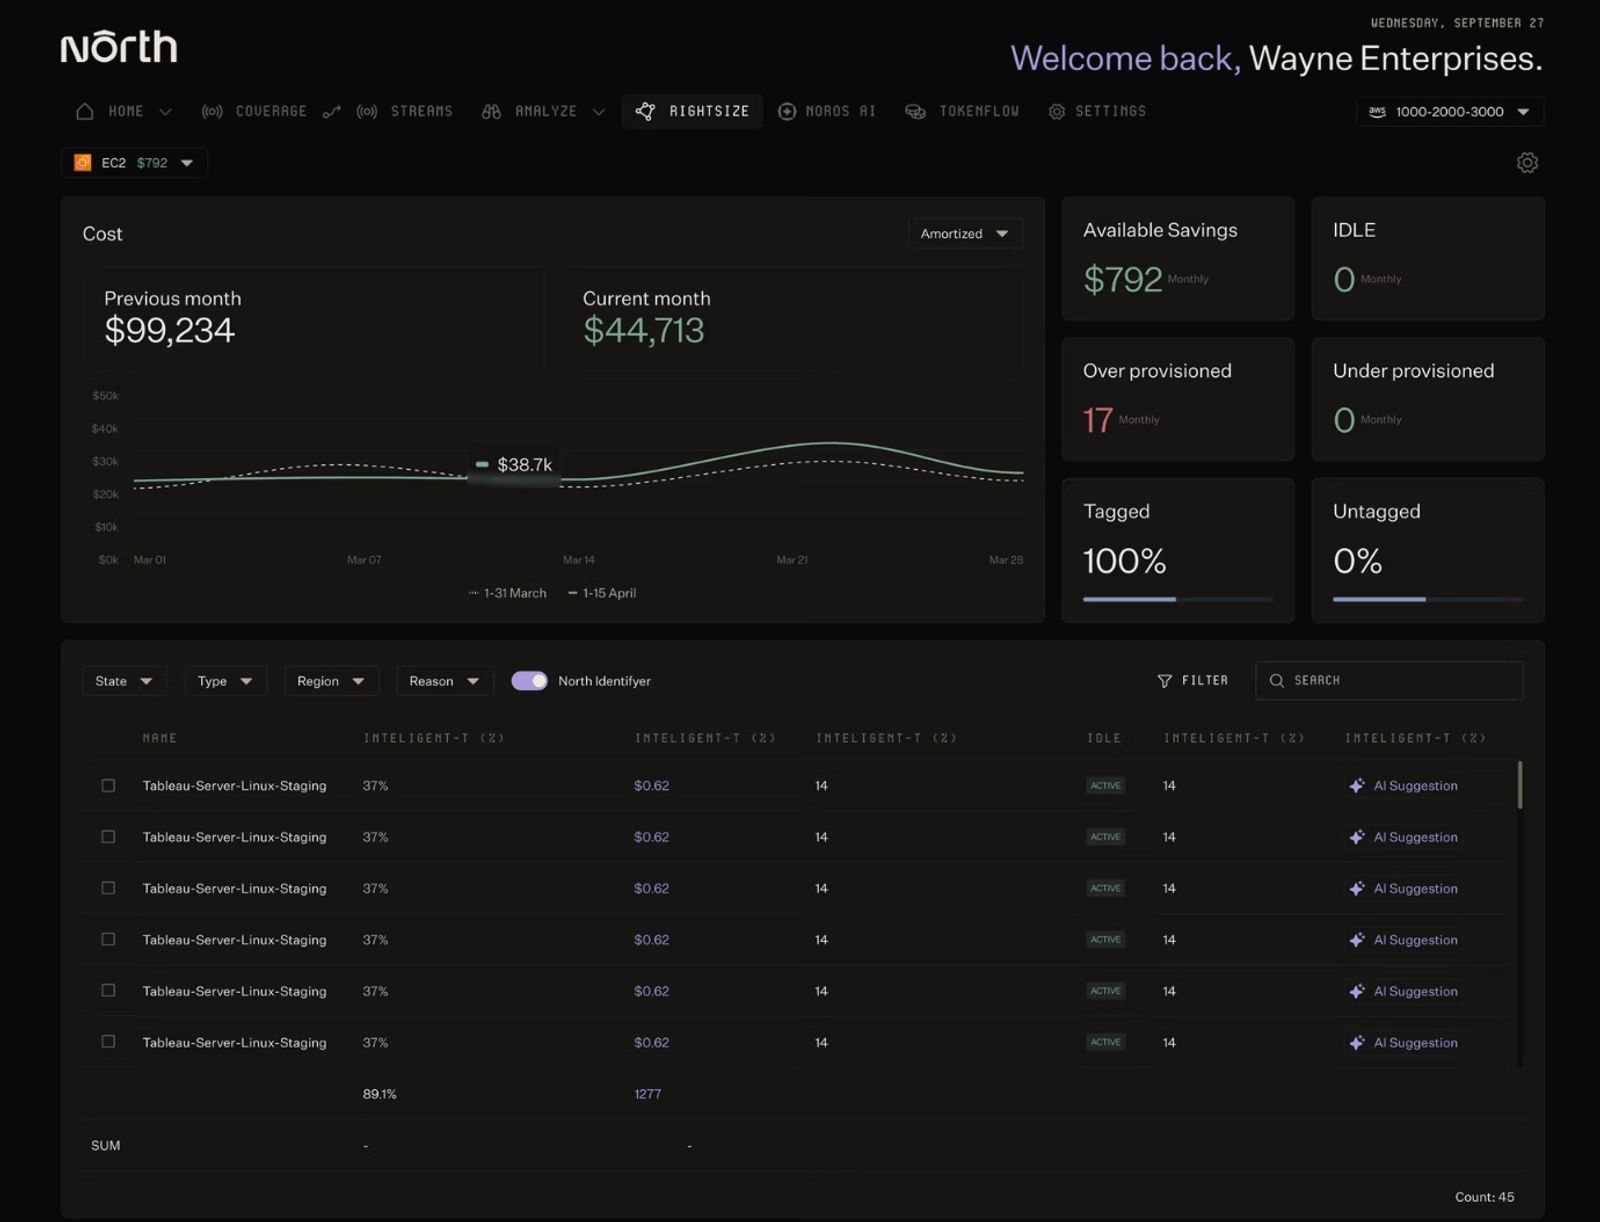
North's Rightsize view flagging over-provisioned resources with specific savings amounts and AI-powered suggestions for each one.
North brings the core cloud finance workflows into one platform:
- Analyze spend across providers
- Allocate costs across teams and products
- Detect anomalies and explain their impact
- Optimize commitments and infrastructure
- Track cloud, AI, and data spend together
- Ask questions through Noros, their FinOps LLM, in plain language
This gives teams one set of numbers instead of several disconnected views.
Flexible commitment management
Commitments can lower cloud rates, but they come with forecasting risk, since usage can shift well before a one- or three-year term ends.
North supports two approaches:
- Flexbot captures three-year savings with month-to-month flexibility, since North holds the contracts and takes on the lock-in risk instead of the customer.
- Autobot uses machine learning to build a commitment strategy for the customer's own accounts, then executes and adjusts it automatically as usage shifts.
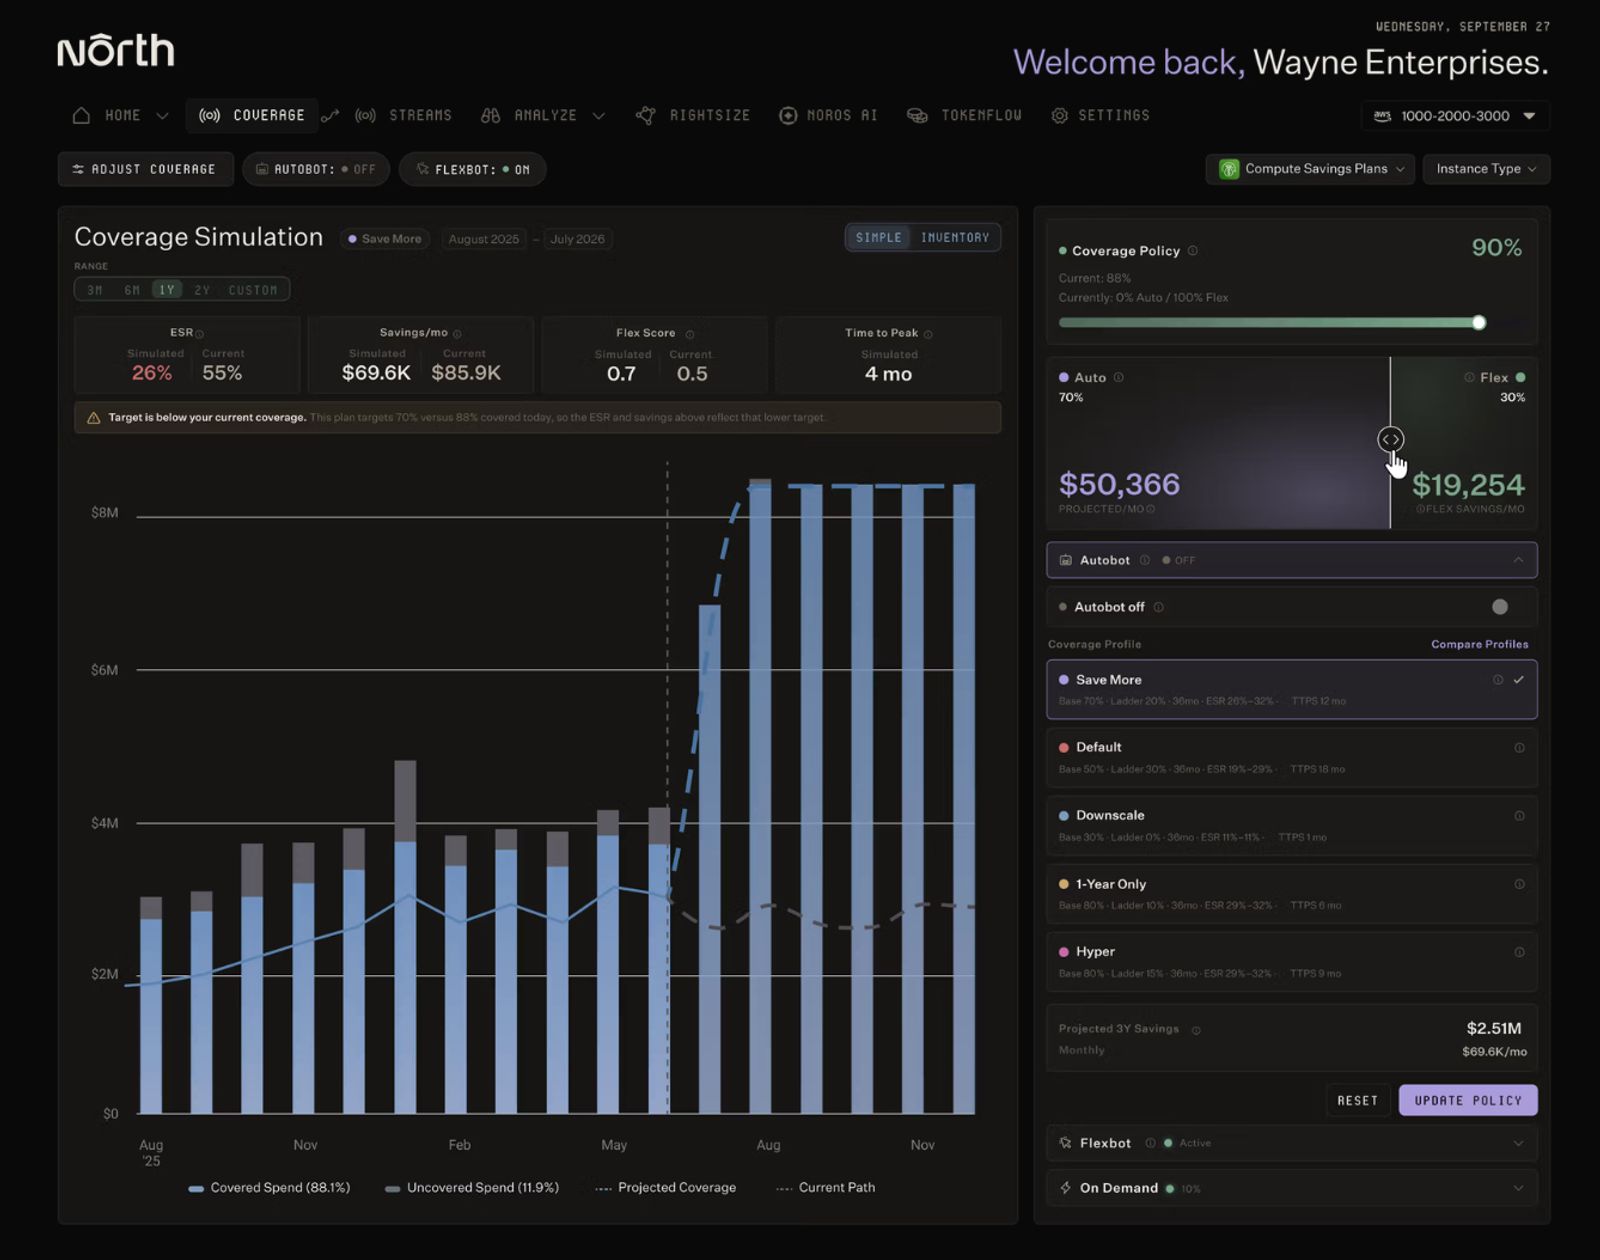
North's Coverage simulation tool modeling coverage, savings, and time to peak across different Autobot and Flexbot splits before committing to a policy.
Teams can use either model, or combine them across workloads, for more flexibility as infrastructure and usage change.
Across both, North optimizes Savings Plans (SPs) and Reserved Instances (RIs) on AWS, Committed Use Discounts (CUDs) on GCP, and Reservations on Azure.
Cost visibility tied to the business
As infrastructure becomes shared, tags alone may not explain who drove each cost.
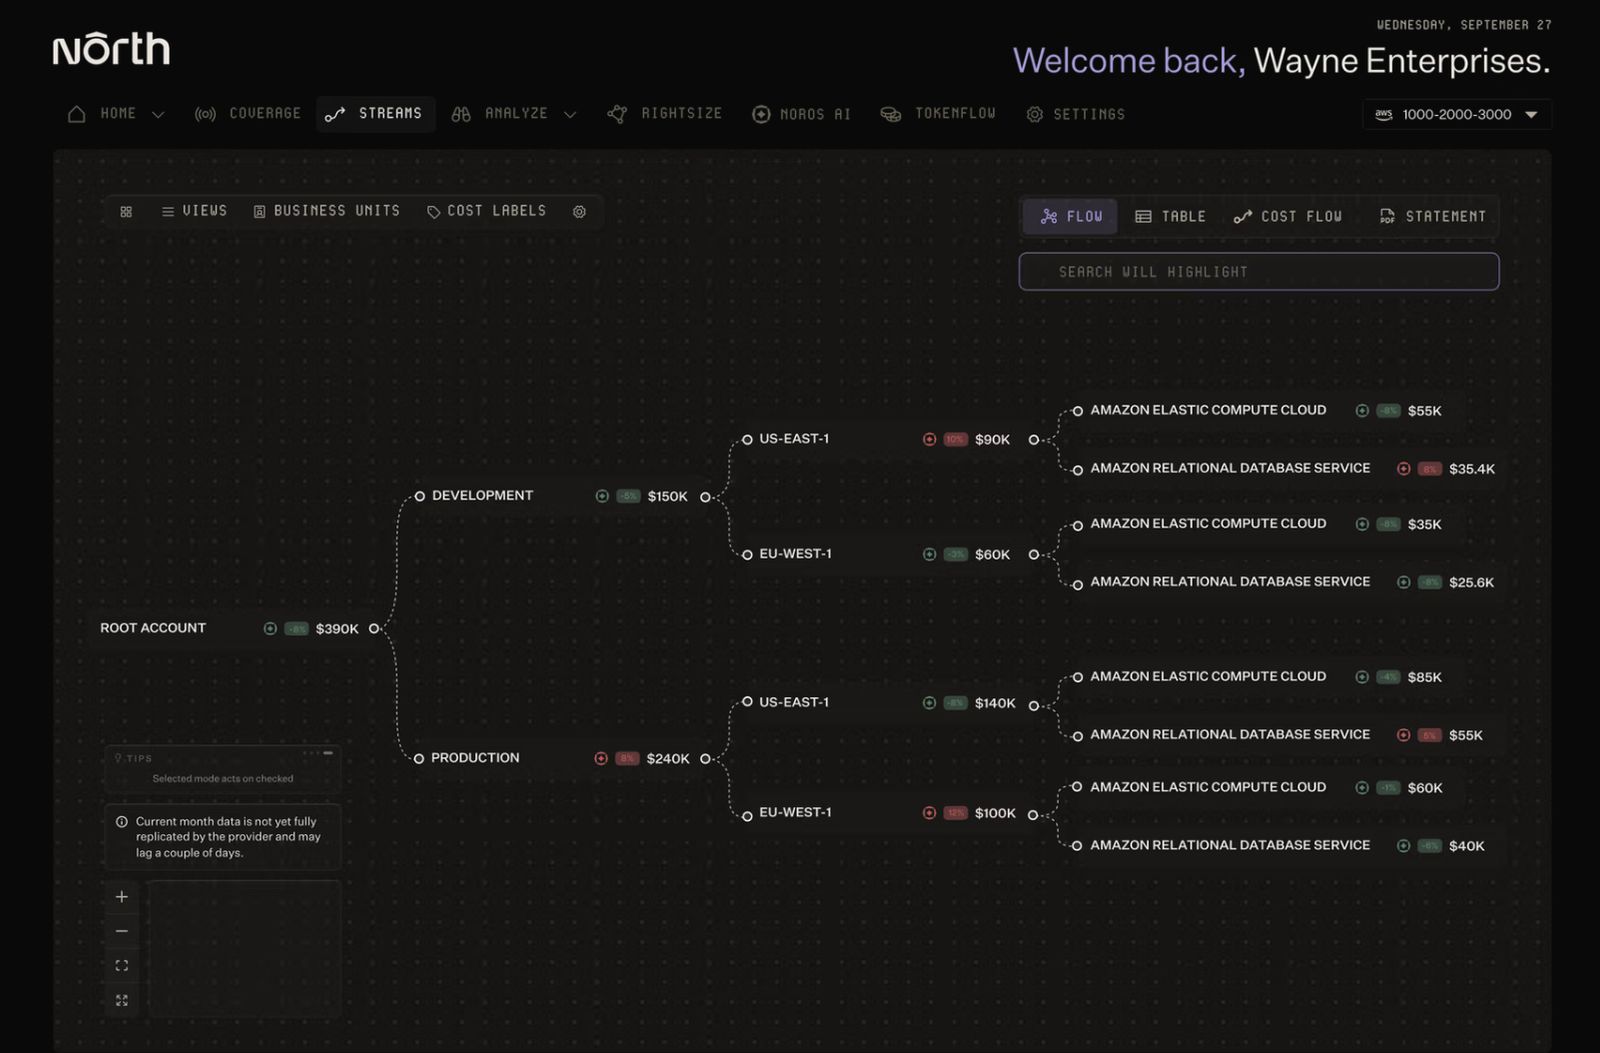
North's Coststreams view tracing spend from a root account down to individual services by environment and region.
North can allocate spend by team, project, customer, product, or environment. It can also connect costs to metrics such as cost per customer or transaction.
The platform continuously monitors infrastructure for anomalies and rightsizing opportunities, and that visibility carries through to AI and data spend as well.
Explore North's free tier to see what one system for your cloud, AI, and data spend looks like.
2. AWS Cost Explorer: Native visibility for AWS-only startups
AWS Cost Explorer is Amazon Web Services’ native interface for analyzing cloud costs and usage.
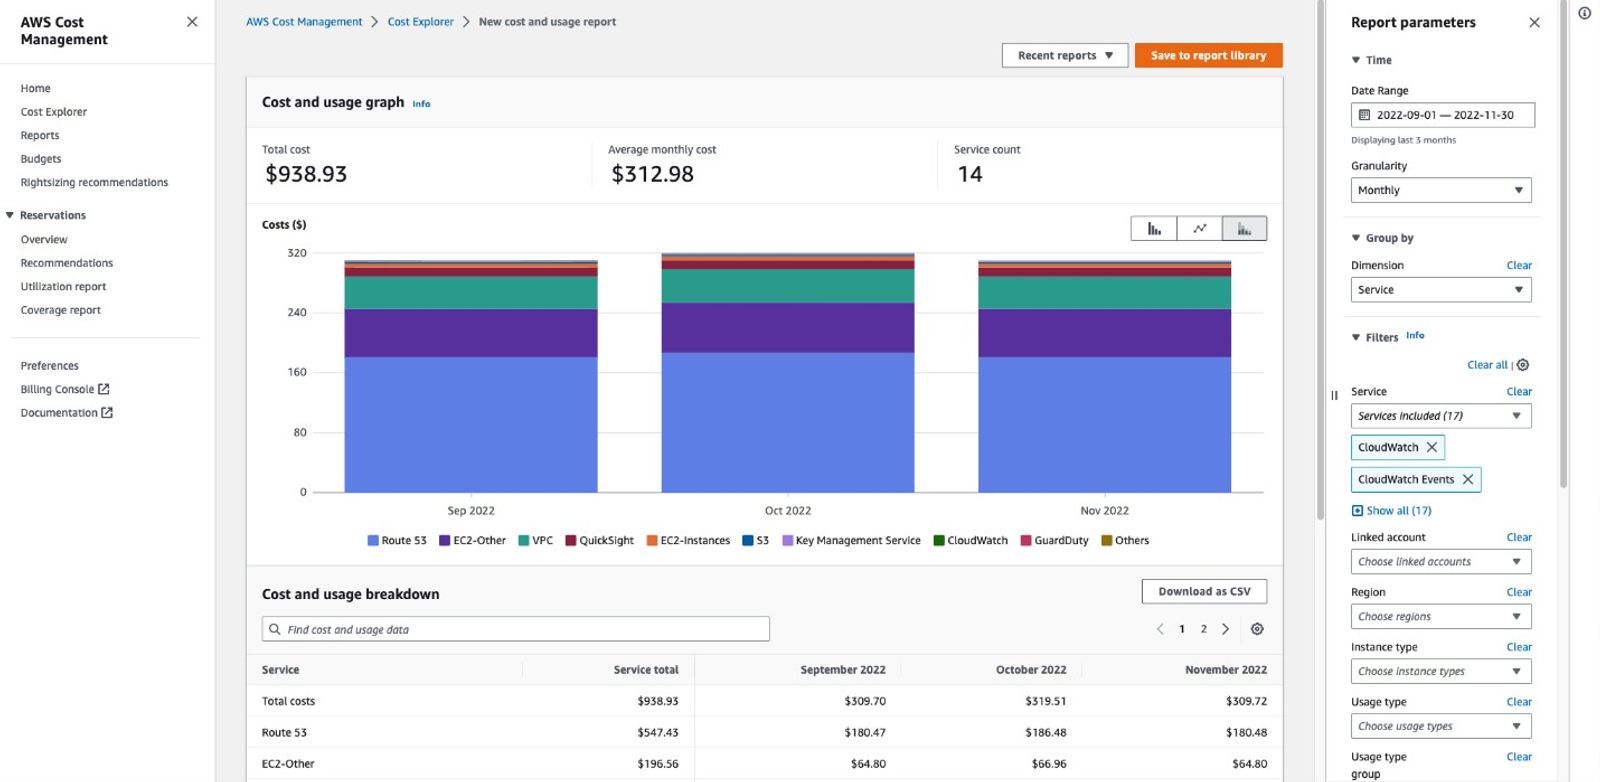
AWS Cost Explorer's report builder, grouping spend by service with monthly breakdowns and downloadable usage data. (Source: AWS Documentation)
Best for: AWS-only startups that need foundational reporting and forecasting.
Pricing: The web interface is free, including 13 months of historical data, daily granularity, and forecasting. API access is billed at $0.01 per request, and hourly granularity, if enabled, adds $0.01 per 1,000 usage records per month.
Key capabilities include:
- Cost analysis by service, account, region, and tag
- Historical cost and usage reporting
- Forward-looking cost forecasts
- Reserved Instance purchase recommendations
- Reservation utilization and coverage analysis
AWS Cost Explorer helps teams investigate cost drivers and track spending trends. AWS Budgets provides separate budget tracking and alerting.
What to consider: Cost Explorer only covers AWS. Cross-cloud allocation, business-level reporting, and automated execution require additional tools or internal workflows.
3. Noros AI: AI FinOps agent for plain-language cost answers
Noros is an AI FinOps agent that answers cloud cost questions in plain language, connecting continuously to AWS, GCP, and Azure billing data.
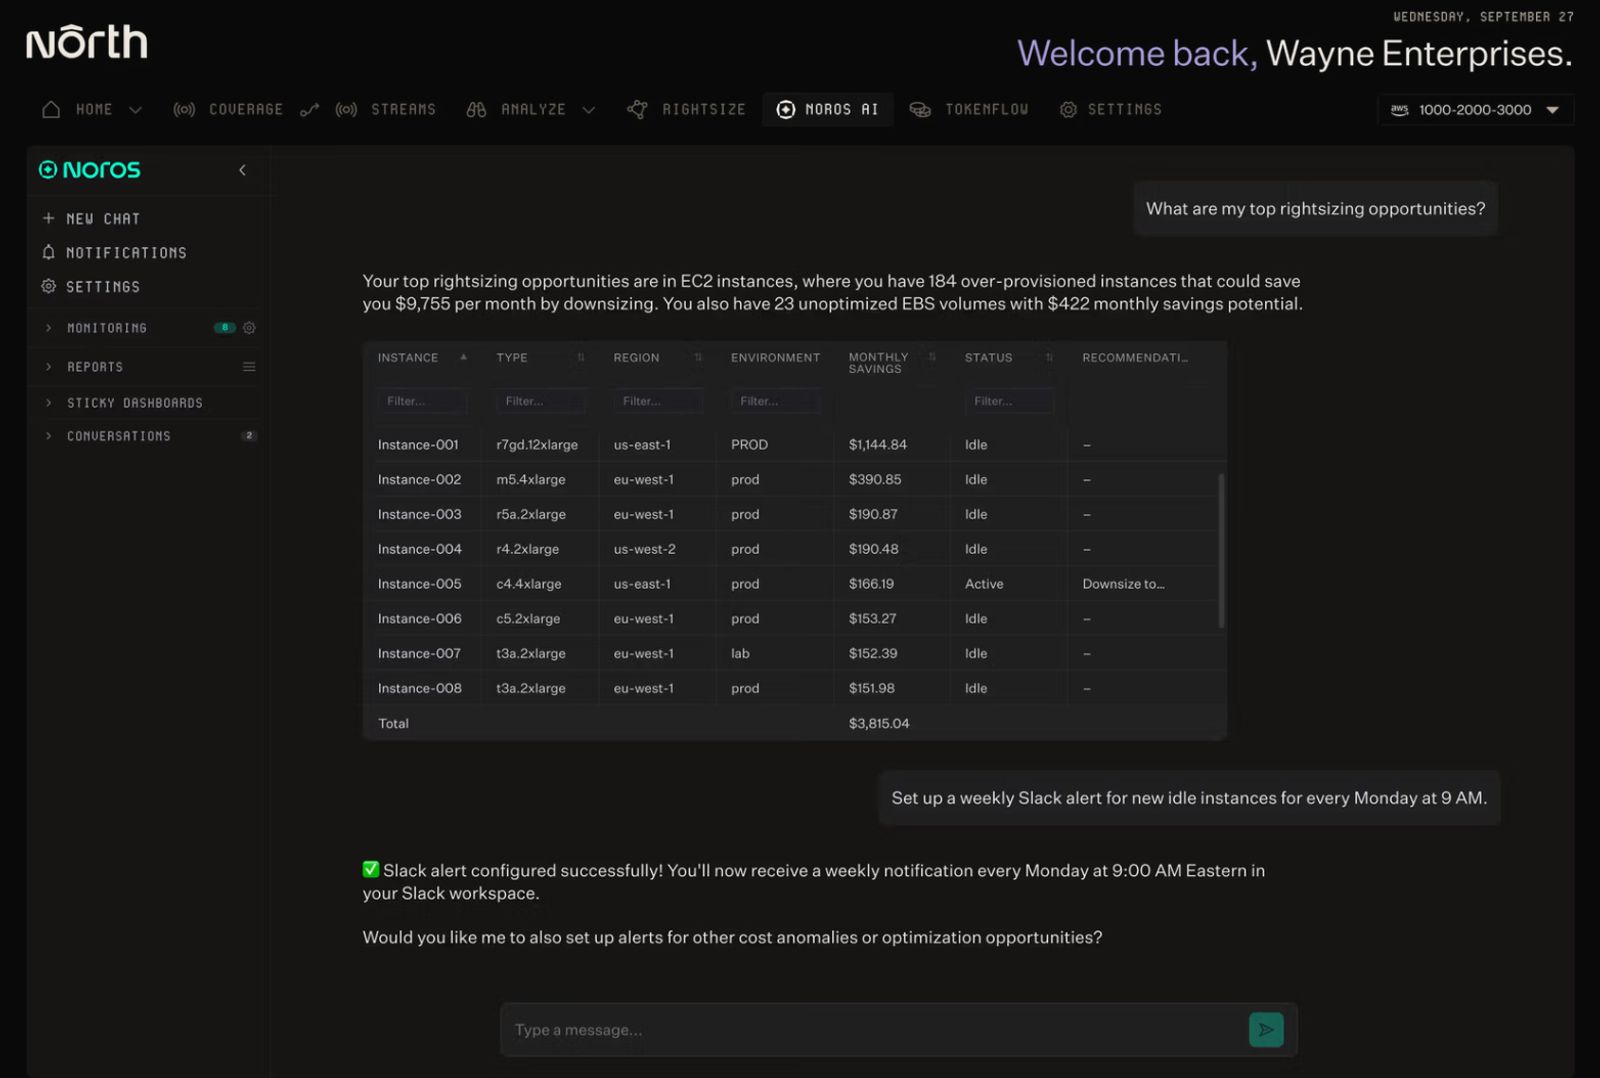
Noros answering a rightsizing question in plain language, then setting up a recurring Slack alert on request.
Best for: Startups and scaleups that want fast, specific answers to cost questions without building a report or pulling in a data analyst.
Pricing:
- Starter: $99/month per workspace. 14-day free trial, 100 queries per month, 1 user, and access to core Noros intelligence.
- Enterprise: $399/month per workspace. 14-day free trial, 1,000 queries per month, up to 5 users, plus advanced monitoring, scheduled insights, and priority support.
Learn more at Noros’ pricing page here.
Key capabilities include:
- Answers plain-language questions like "why is my bill so high this month" with a grounded response in seconds
- Turns each question into a widget through Generative Dashboards, taking minutes from question to working dashboard, with no data analyst in the loop
- Tracks a FinOps maturity score that reflects commitment coverage, utilization, and savings performance over time
- Flags anomalies down to the resource level and explains what's actually driving them
- Delivers recurring reports and alerts on schedule, right in Slack or the app
- Connects through read-only access, so Noros can analyze your cloud data without ever writing to your accounts
Noros is built by North.cloud, drawing on years of FinOps experience across hundreds of engineering and finance teams. Start a free trial at noros.ai to see it against your own cloud data.
4. ProsperOps: Automated multi-cloud rate optimization
ProsperOps automates cloud commitment portfolios across AWS, Azure, and GCP.
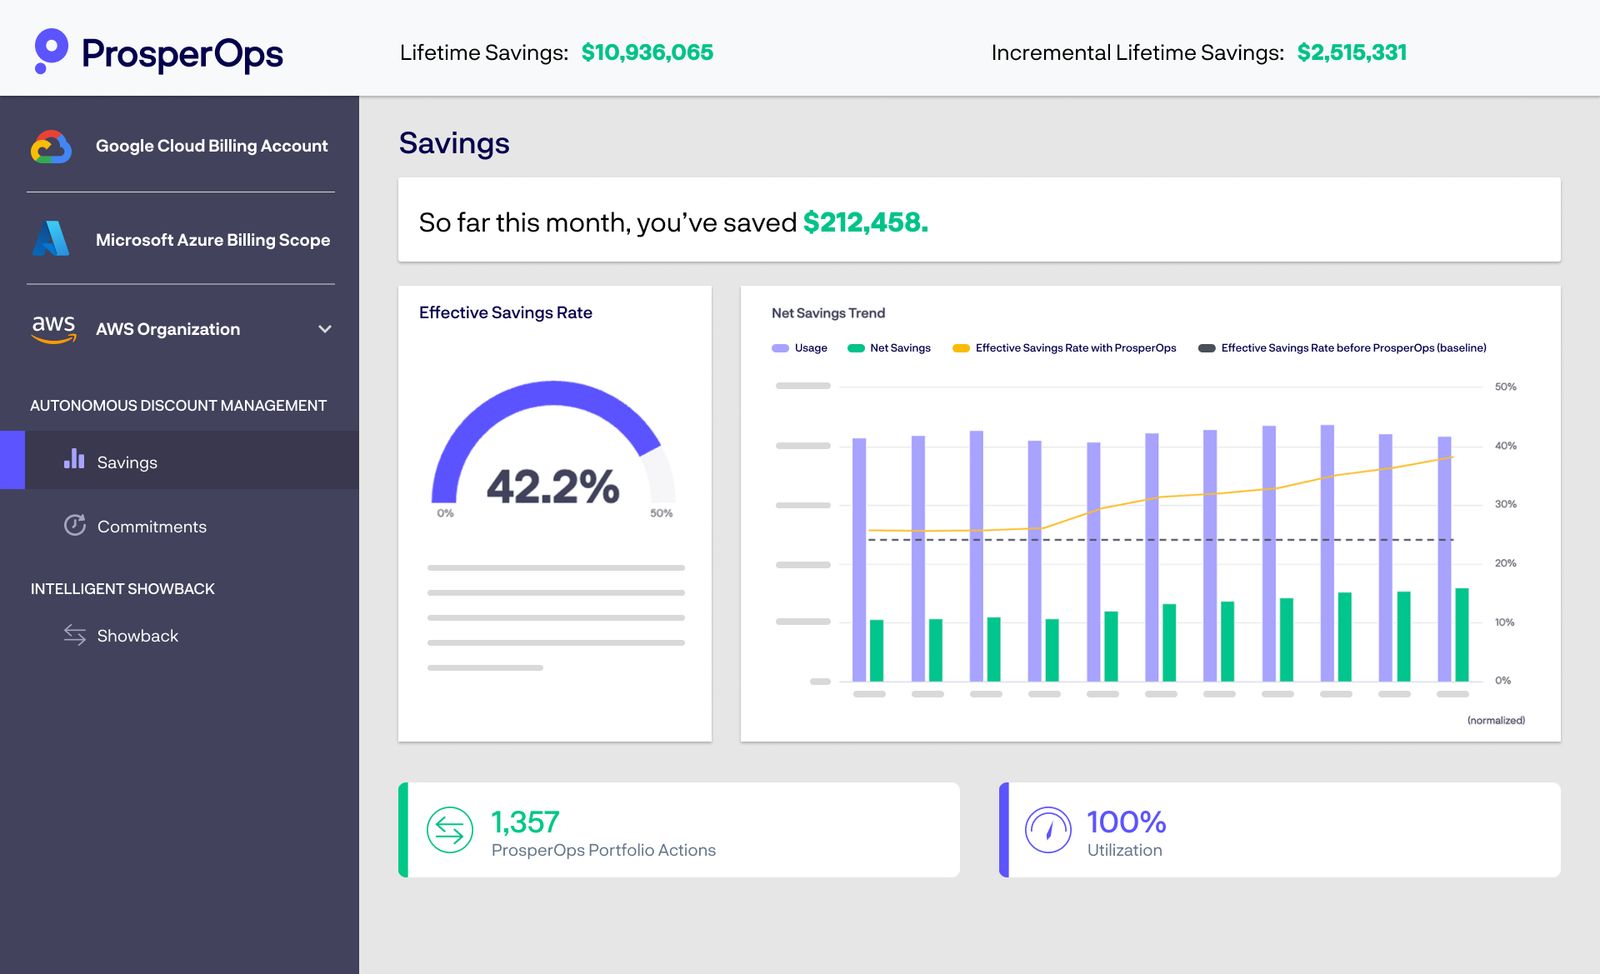
ProsperOps' savings dashboard, tracking effective savings rate and lifetime totals across connected cloud accounts. (Source: ProsperOps)
Best for: Teams that want to automate rate optimization across one or more cloud providers.
Pricing: ProsperOps doesn't publish rates. It offers a free savings analysis, then charges either a share of realized savings or a flat fee per managed resource, depending on the plan.
Key capabilities include:
- Automated commitment purchasing and management
- Continuous portfolio adjustments
- AWS SPs and RI optimization
- Azure rate optimization
- GCP rate optimization
- Unified savings measurement across providers
ProsperOps is designed to reduce the manual forecasting and portfolio management required to maintain commitment coverage.
What to consider: ProsperOps focuses on commitment-based rate optimization, not the full FinOps stack. AWS support is the most established, with Azure and GCP added more recently. It doesn't cover allocation, unit economics, anomaly management, or broader financial reporting, so teams typically need separate tooling for those. ProsperOps was acquired by Flexera in January 2026 and currently operates as a standalone product, worth keeping an eye on as that integration progresses.
5. CloudZero: Cost intelligence and unit economics
CloudZero gives visibility into cloud spend, mapped against business dimensions such as customers, products, features, and transactions.
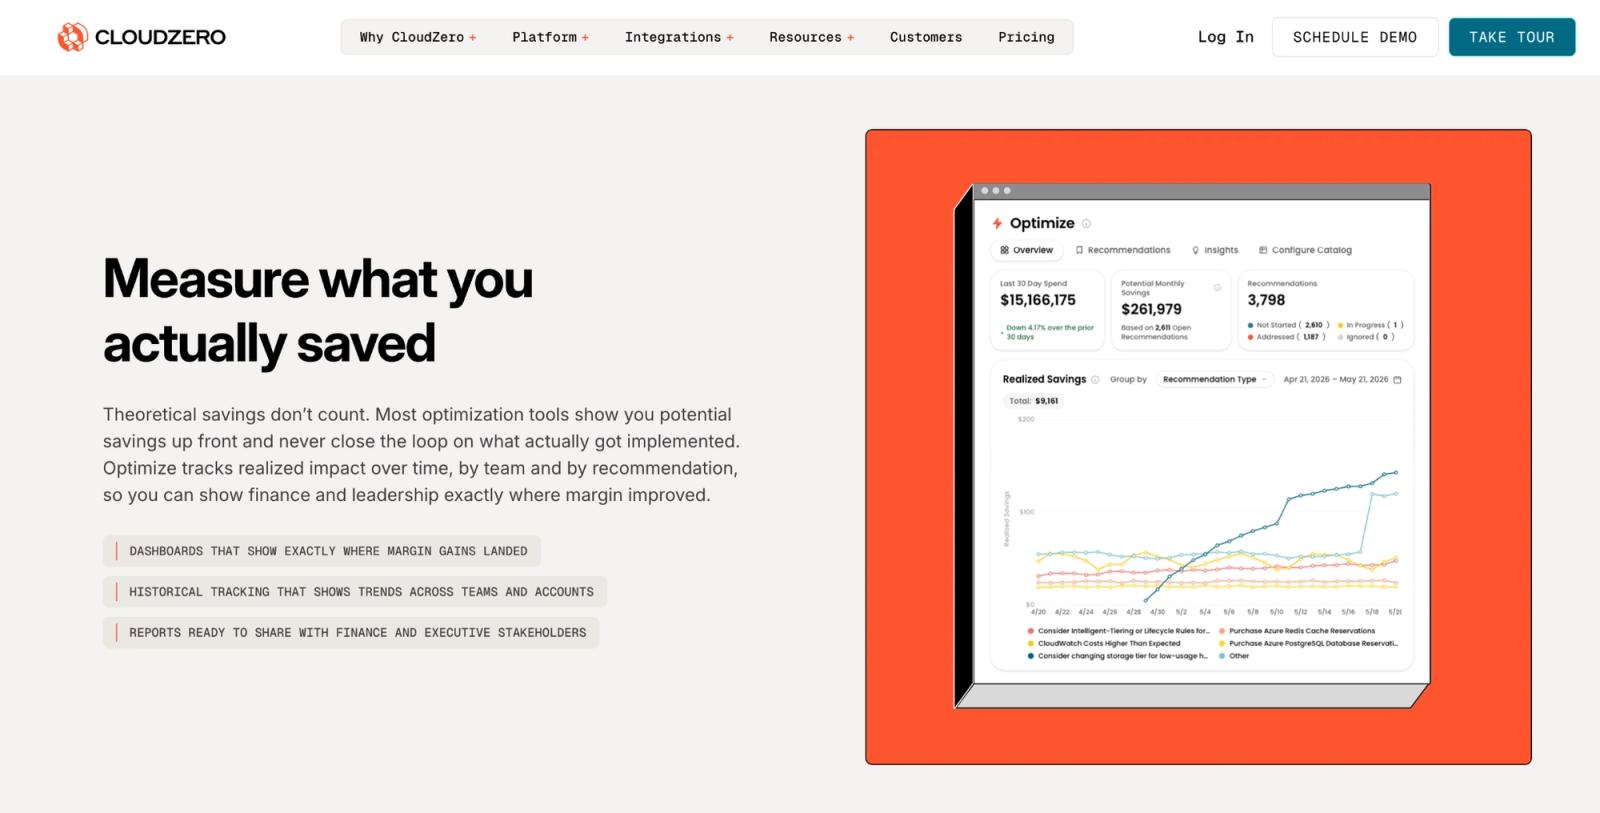
CloudZero's Optimize view, tracking realized savings against recommendations over time. (Source: CloudZero)
Best for: Teams that need to understand what drives spend and measure unit economics.
Pricing: CloudZero is quote-based, with no per-seat fees. It doesn't publish rates, so getting a specific number requires talking to sales.
Key capabilities include:
- Multi-dimensional cost allocation
- Cost per customer, product, or transaction
- Budgeting and forecasting
- Anomaly detection
- Cloud and AI cost analysis
- Business-level cost reporting
What to consider: CloudZero focuses on visibility and cost intelligence rather than active optimization, so recommendations tend to stop short of automated execution. Teams that want the spend reduced automatically, not just explained, may need a second tool alongside it
6. Vantage: Multi-provider cost management
Vantage provides cost reporting and optimization across cloud, Kubernetes, data, AI, and software providers.
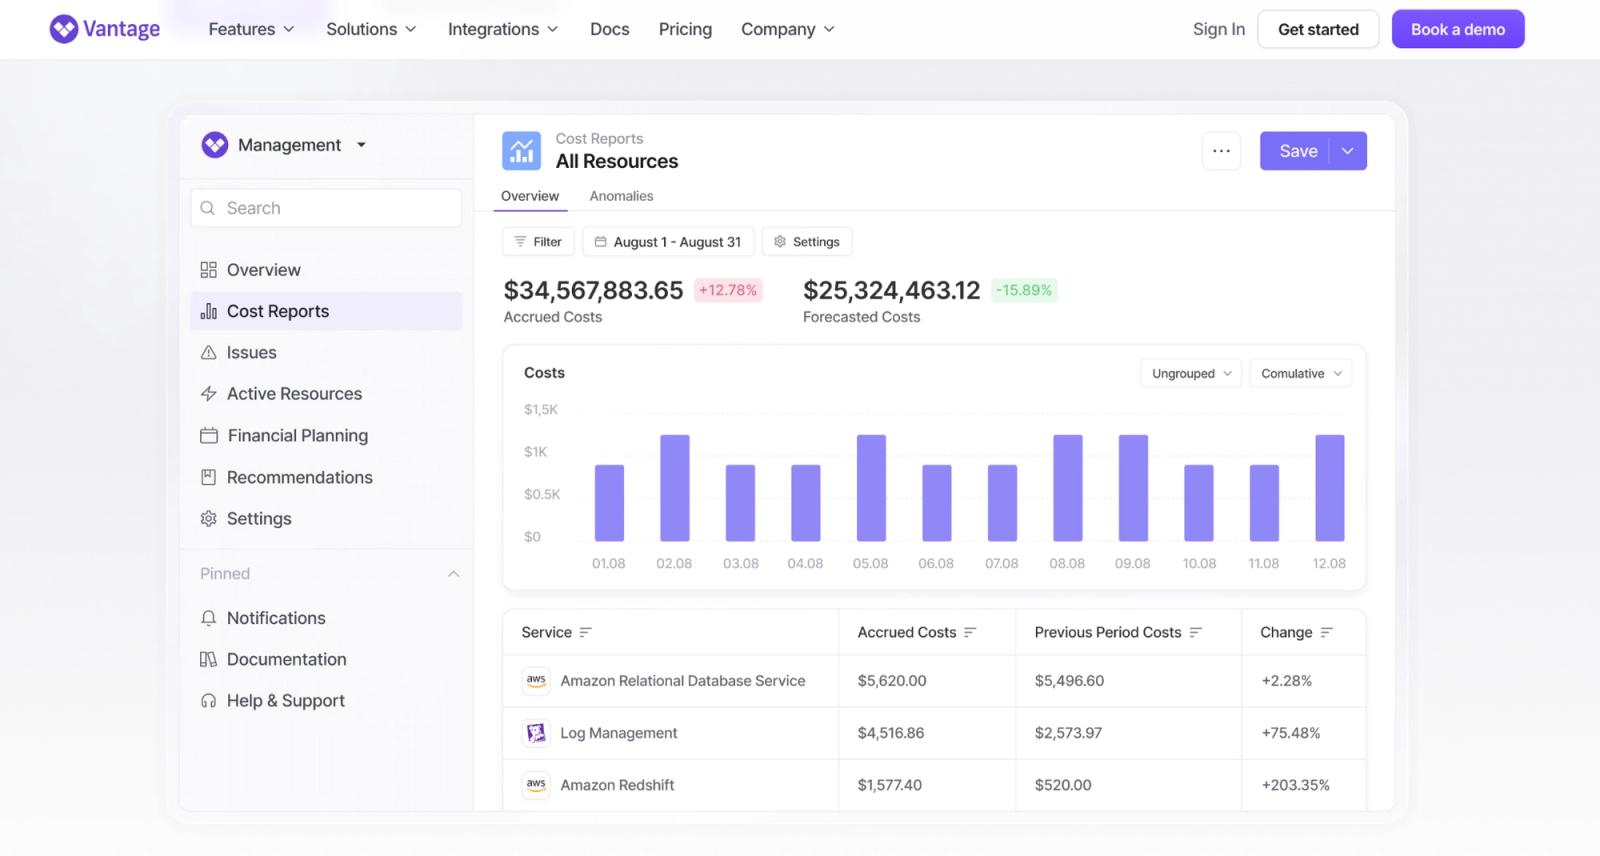
Vantage's Cost Reports dashboard, shown on Vantage's own website. (Source: Vantage)
Best for: Teams that need consolidated cost visibility across several infrastructure services.
Pricing:
- Starter: Free. Up to $2,500 in tracked spend, 3 users, 6 months of data retention.
- Pro: $30/month. Up to $7,500 in tracked spend, 5 users.
- Business: $200/month. Up to $20,000 in tracked spend, 10 users, 12 months of retention.
- Enterprise: Custom, unlimited spend and users.
Key capabilities include:
- Unified cost reports across multiple providers
- Budgeting and forecasting
- Kubernetes cost allocation and efficiency reporting
- Unit cost tracking through business metrics
- Optimization recommendations
- Team-specific dashboards and reports
Vantage can combine cloud, Kubernetes, and shared infrastructure costs within the same reports. Teams can also add business metrics to track measures such as cost per customer or request.
What to consider: Automated optimization only covers AWS Savings Plans specifically, it’s not across all providers. Teams should confirm which actions are automated for Azure and GCP versus what stays manual. Plans are also capped by tracked spend, not just features, so a team growing past $20,000 in monthly spend needs Enterprise regardless of which capabilities they actually use, and data retention is limited to 6 or 12 months on the lower tiers.
7. Harness Cloud and AI Cost Management: Engineering-led optimization
Harness combines cost visibility with cloud governance, Kubernetes optimization, commitment planning, and AI cost management.
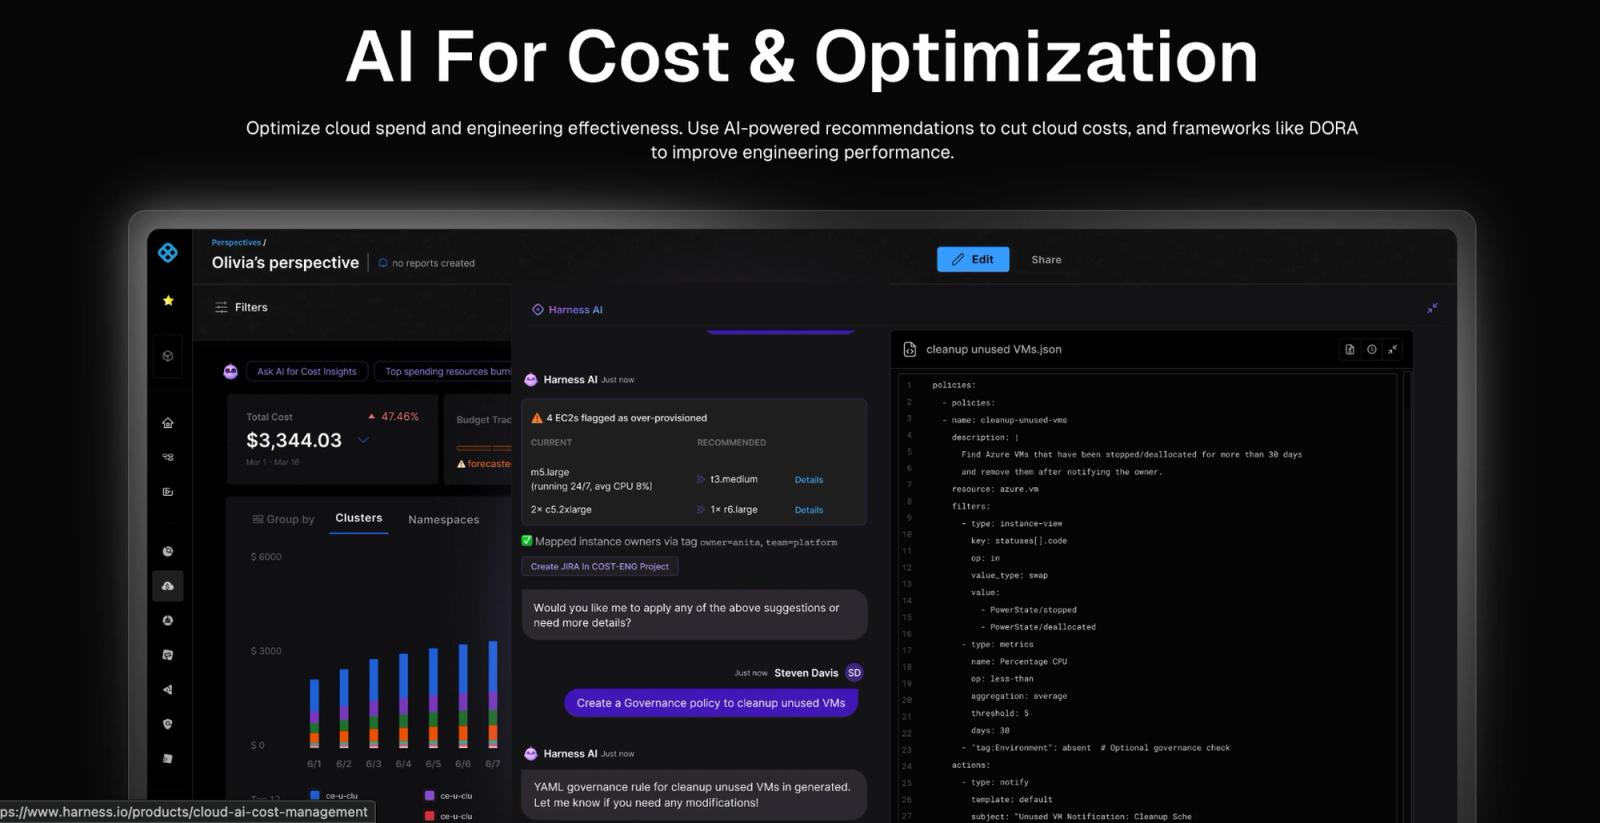
Harness AI flagging over-provisioned instances and generating a governance policy, shown on Harness's homepage. (Source: Harness)
Best for: Engineering and platform teams that want cost controls tied closely to infrastructure operations.
Pricing: Harness offers three tiers, Free, Essentials, and Enterprise, but isn't transparent about pricing for the paid tiers upfront. Both require contacting sales for a quote.
Key capabilities include:
- Kubernetes autoscaling, bin-packing, and Spot orchestration
- Commitment planning and management
- Cost anomaly detection
- Policy-based governance
- Automated remediation
- Token and inference cost visibility
What to consider: Harness is part of a broader software delivery platform, built primarily for engineering teams rather than cross-functional FinOps collaboration. Teams should evaluate whether they need its wider engineering ecosystem or holistic cloud financial management.
8. Finout: Cloud and AI cost allocation
Finout provides allocation, governance, reporting, and unit economics across cloud, Kubernetes, software, and AI services.
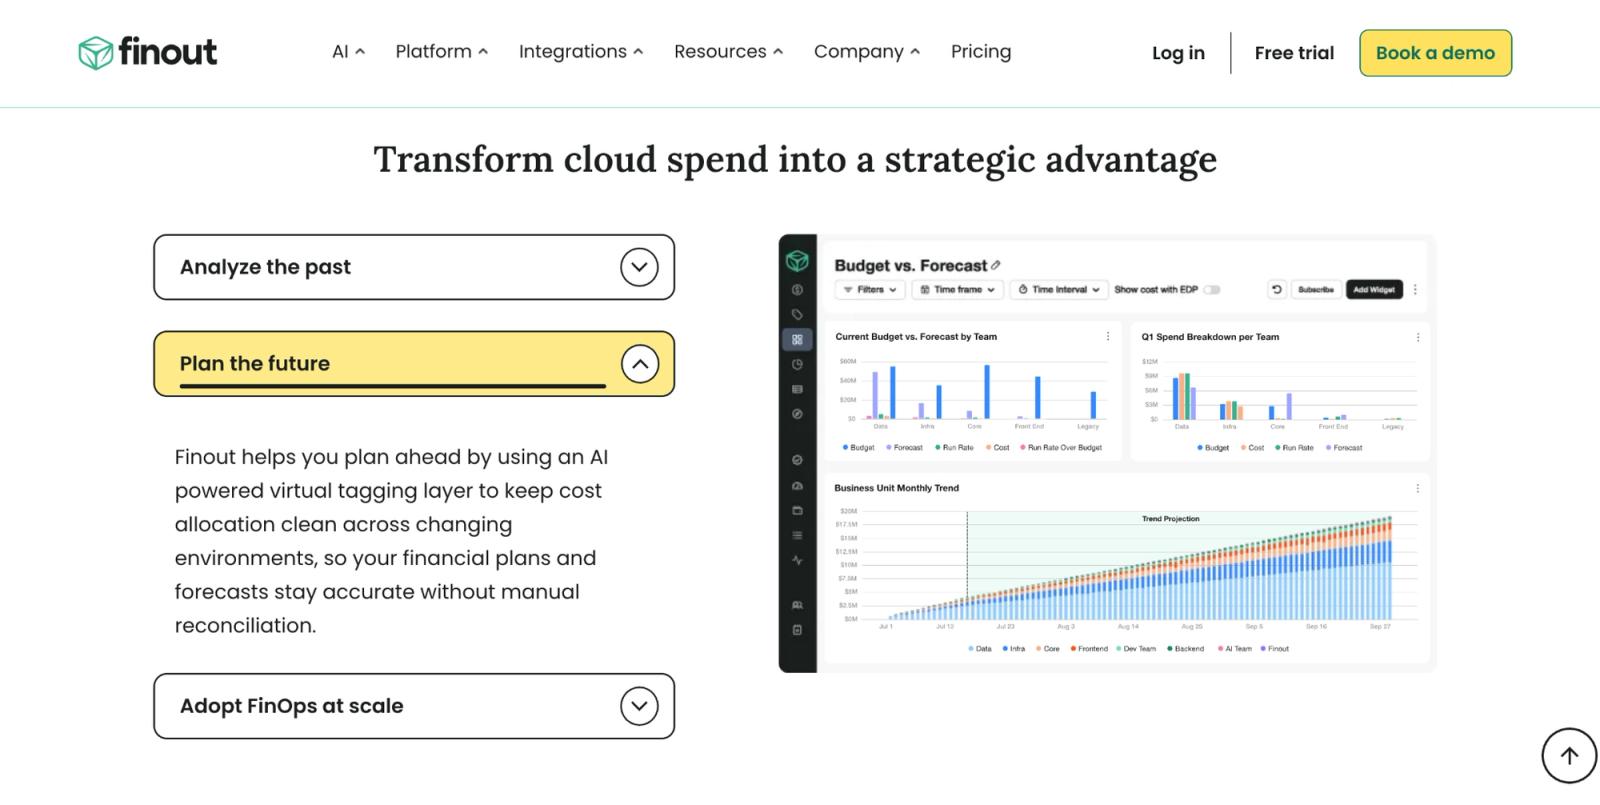
Finout's Budget vs. Forecast view, shown on Finout's homepage under its "Plan the future" capability. (Source: Finout)
Best for: Teams that need detailed allocation across complex or shared infrastructure.
Pricing: Finout charges a flat fee tied to a committed cloud and AI spend tier, not a per-seat charge. The fee depends on the scale of infrastructure connected, cost centers, data volume, and integrations like Kubernetes, so two companies on the same plan tier can land at very different price points. Finout doesn't publish list prices for any of its three tiers; they all require a quote based on the actual environment.
Key capabilities include:
- Dynamic allocation through Virtual Tags
- Budgeting and forecasting
- Anomaly detection
- Unit cost reporting
- Cloud and AI cost visibility
- Shared-cost allocation
Finout’s Virtual Tags let teams organize spending without modifying the underlying infrastructure tags. The platform also supports budgeting, forecasting, and anomaly detection across shared cost sources.
What to consider: Finout emphasizes visibility, allocation, and governance rather than automated commitment execution. Virtual Tags solve a real allocation problem without touching underlying infrastructure, but rate optimization and rightsizing aren't the platform's core strength. Buyers should compare its automated optimization capabilities with their actual commitment and resource-management requirements, since some of that work may still need a separate tool.
9. Flexera: Multi-cloud cost management and governance
Flexera provides cloud cost management, optimization, and governance across multi-cloud and hybrid environments.
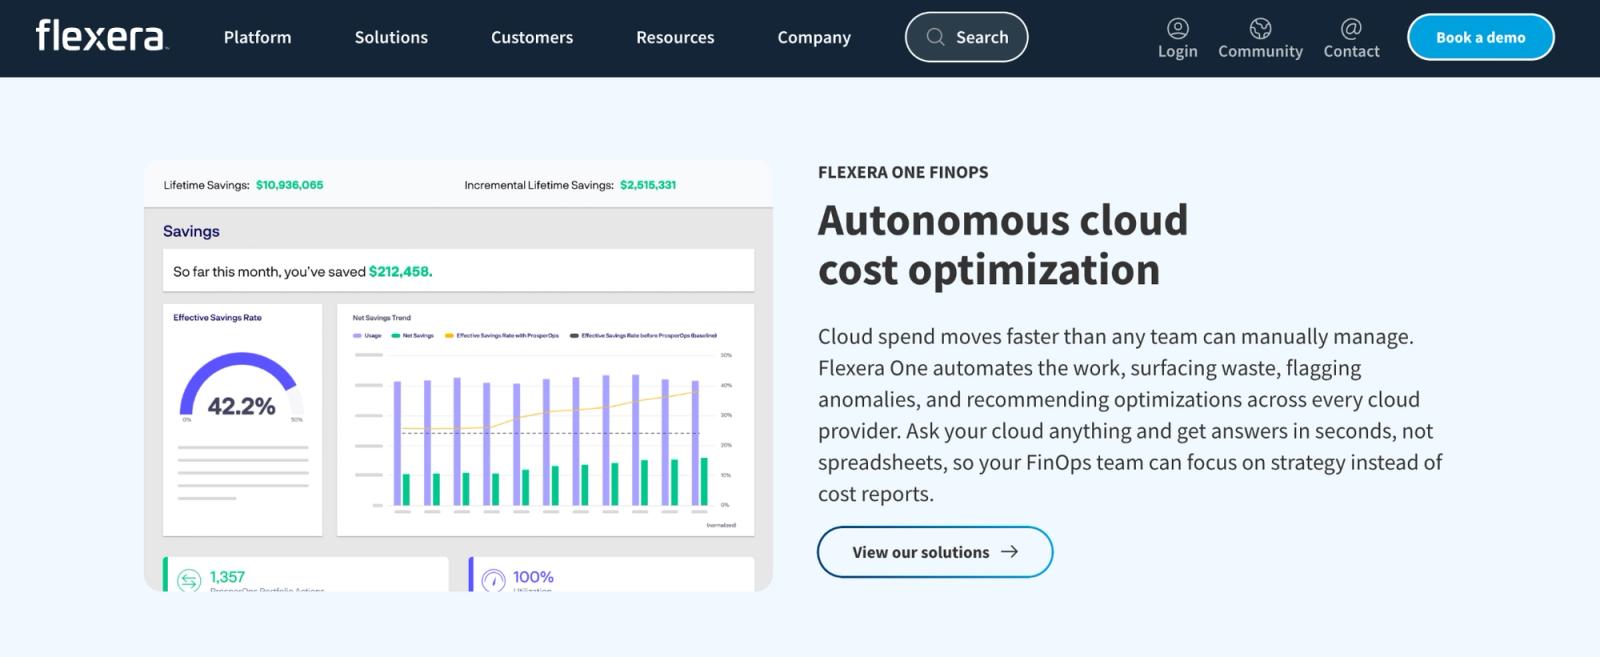
Flexera One FinOps' savings dashboard, shown on Flexera's own homepage using the same interface as ProsperOps. (Source: Flexera)
Best for: Organizations that need centralized cost control across several providers, accounts, and business units.
Pricing: Flexera doesn't publish rates. It's quote-based, typically priced as a percentage of managed cloud spend, and third-party estimates put that in the 0.5-2% range annually. Contracts commonly run 12 to 36 months.
Key capabilities include:
- Multi-cloud cost visibility
- Budgeting and forecasting
- Cost allocation and showback
- Optimization recommendations
- Policy-based actions
- Commitment and discount analysis
- Reporting across business units
Flexera combines cost visibility with recommendations and policy-driven actions for reducing idle or overprovisioned resources. It also supports major cloud providers and less common regional platforms.
What to consider: Flexera is built for large, complex environments, and its pricing and contract structure reflect that. Multi-year terms are common, and packaging is often negotiated at the enterprise level, which can make it harder to start small or scale down scope later without renegotiating. Teams should weigh implementation effort and contract length against how much of the platform they'll actually use.
10. IBM Cloudability: Enterprise FinOps management
IBM Cloudability is an enterprise FinOps platform for managing cloud spending across providers, teams, and business units.
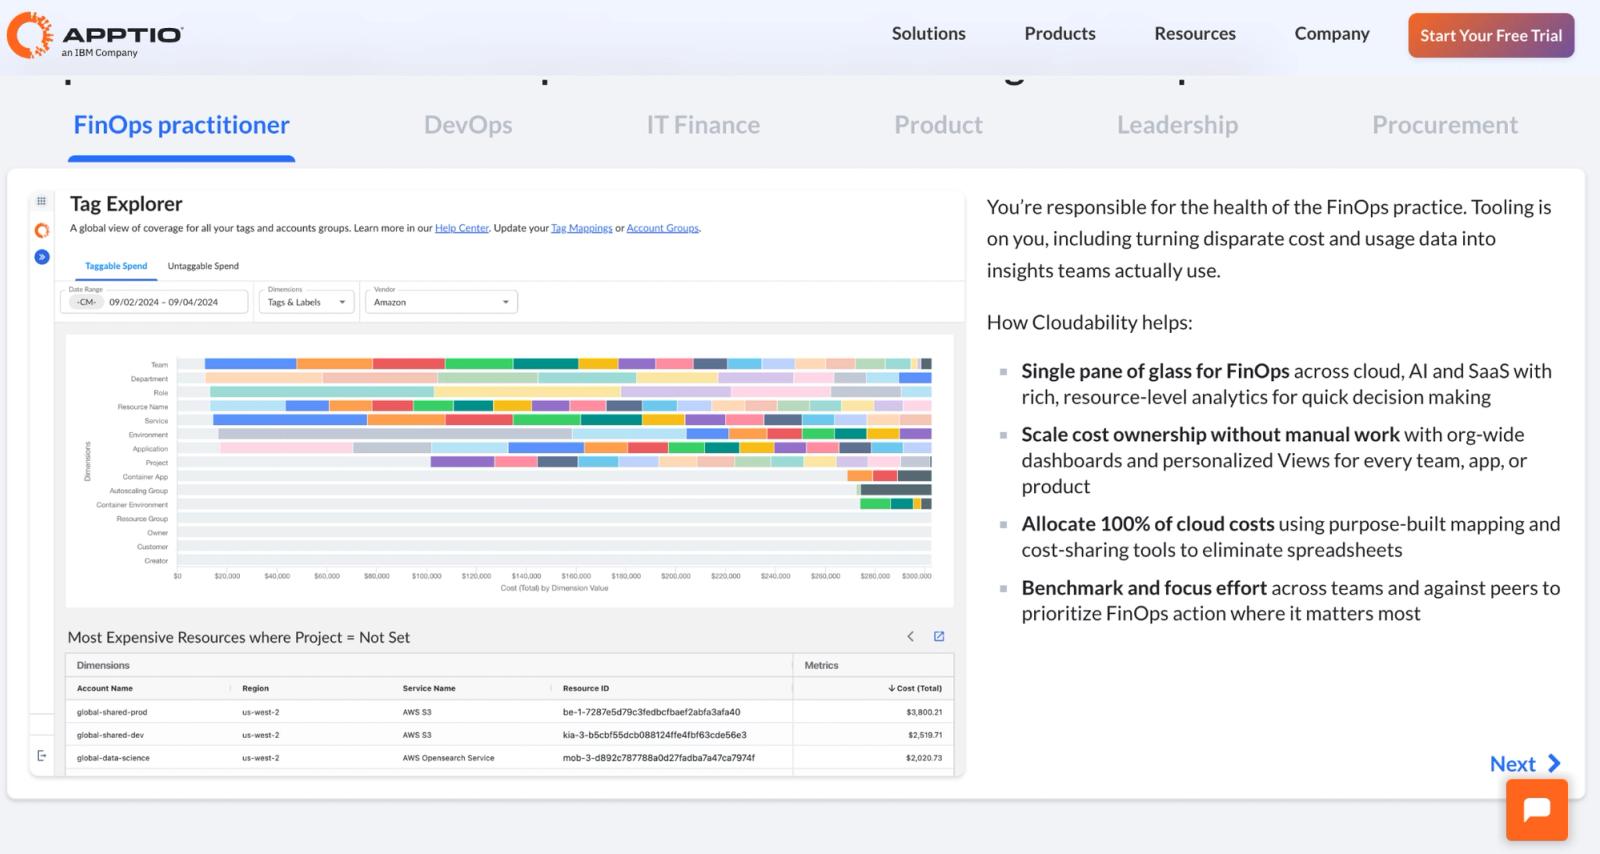
Cloudability's Tag Explorer, surfacing spend by tagging dimension and flagging untagged high-cost resources. (Source: Cloudability)
Best for: Mature FinOps organizations that need planning, allocation, governance, and optimization across complex environments.
Pricing: Cloudability has a free tier for up to 3 cloud accounts. Paid tiers, Essentials, Standard, Premium, and Enterprise, are quote-only and priced as a percentage of managed cloud spend.
Key capabilities include:
- Multi-cloud cost visibility
- Financial planning and forecasting
- Business mapping and cost allocation
- Personalized dashboards and views
- Unit cost analysis
- Optimization recommendations
- Governance across finance and engineering
Cloudability lets organizations create tailored cost views for teams, applications, and products. It can also connect cloud costs with business metrics to support unit economics.
What to consider: Cloudability is built for established FinOps programs and complex organizational structures. Its optimization recommendations and commitment purchasing are real, but automated rightsizing and Spot management aren't core strengths, so teams focused on active resource optimization may need a second tool. Teams should also assess implementation effort, pricing transparency, and the operational support required.
Pick a cloud cost management tool that fits where you are now
The right tool depends on your infrastructure, provider mix, and available capacity.
Native dashboards may cover basic reporting in simpler environments. As commitments, shared services, and multiple providers add complexity, manual workflows become harder to maintain.
The value of a cloud cost platform comes from the work it removes:
- Repeated analysis
- Manual commitment planning
- Disconnected reporting
- Delayed responses to cost changes
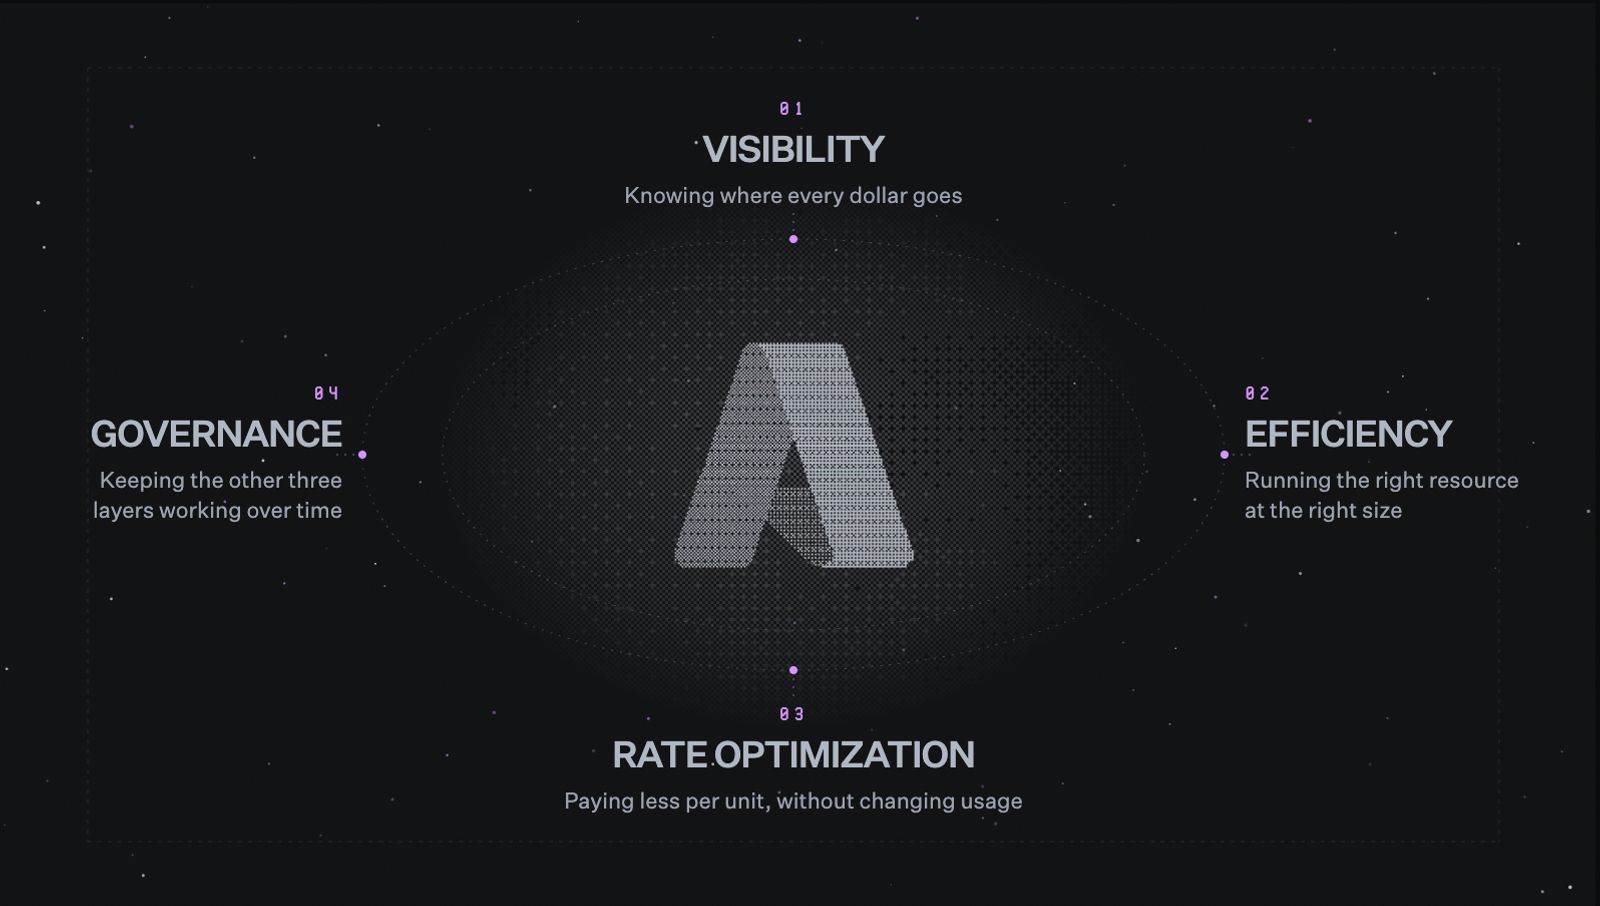
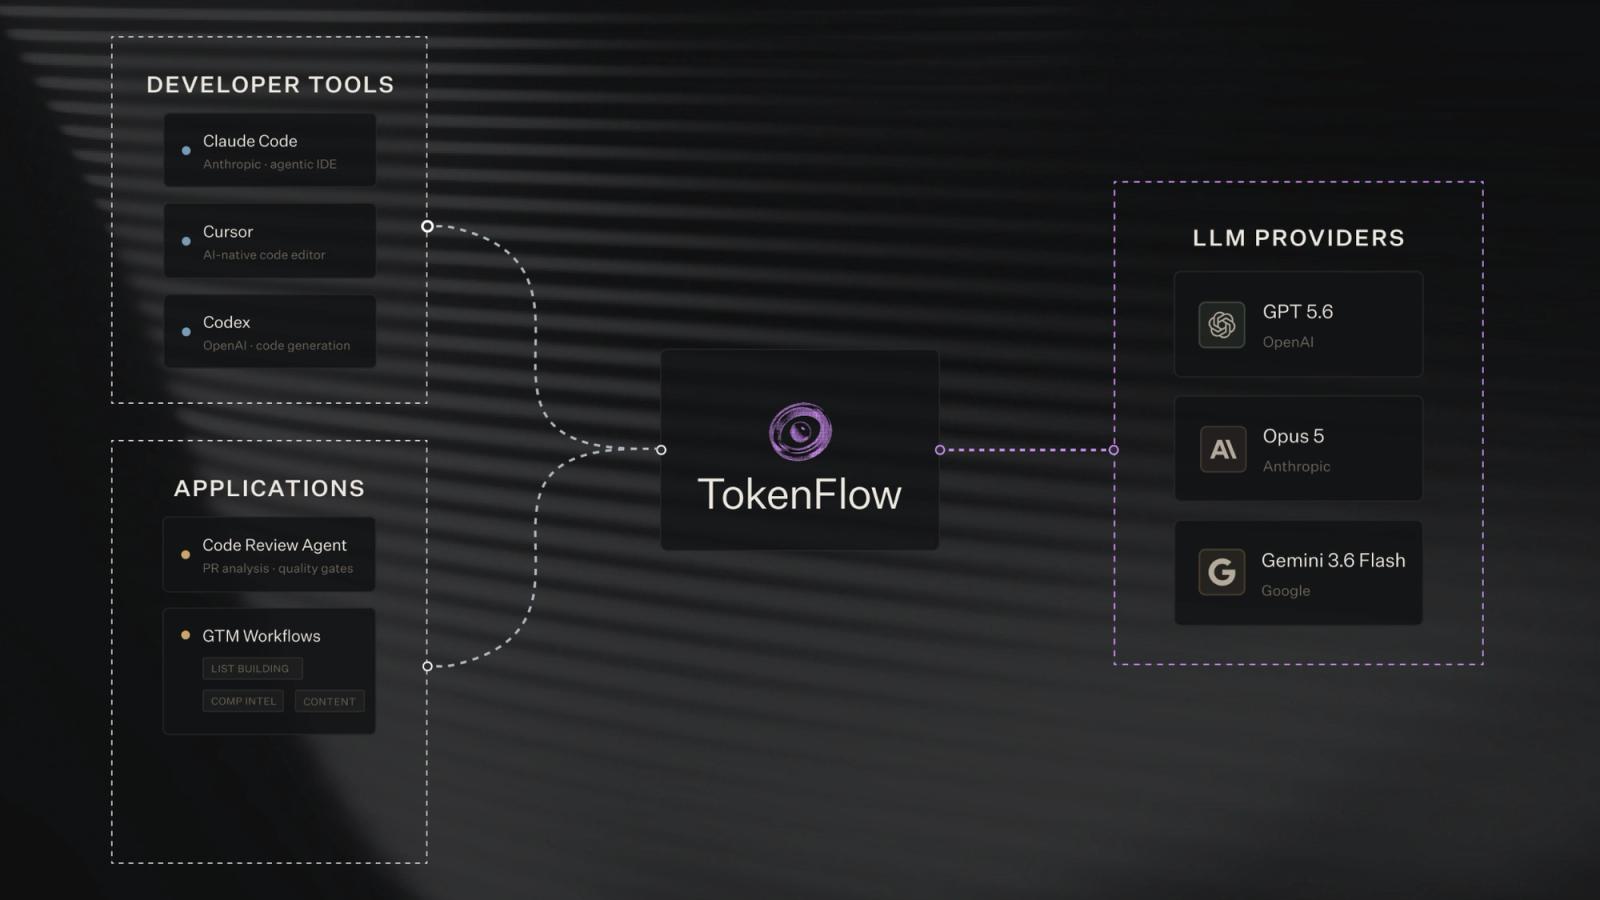
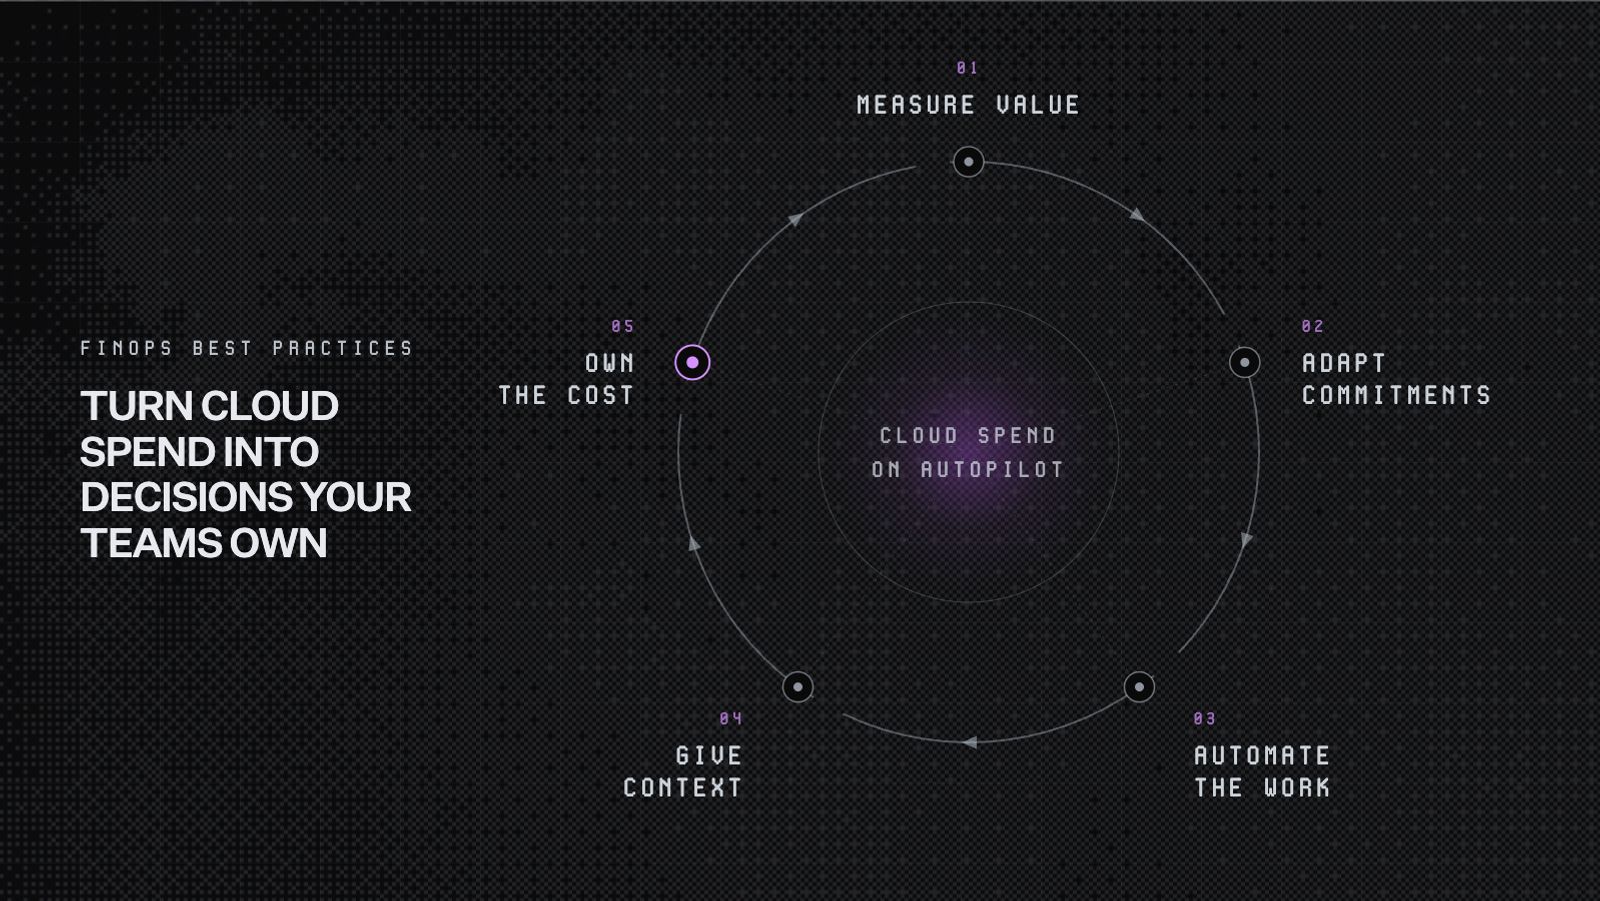
North brings those workflows into one system across AWS, GCP, and Azure. It also connects cloud spend with AI and data costs from platforms such as OpenAI, Anthropic, and Snowflake.
Explore North’s free tier to see how we can simplify cloud finance across your stack.
FAQs
Answers to common questions about the product or feature covered in this post.
What is a cloud cost management tool?
A cloud cost management tool helps teams track, allocate, and reduce cloud spending.
Some tools focus on visibility through dashboards, reports, and budget alerts. Others also automate commitments, rightsizing, anomaly detection, and cost allocation.
When should a startup invest in a cloud cost management tool?
A company should consider dedicated tooling when manual cost management becomes difficult to maintain.
Common signs include:
- Cloud spend is rising faster than expected
- Several teams share the same infrastructure
- Commitment decisions require regular analysis
- Costs span multiple providers or services
- Recommendations are identified but rarely implemented
Monthly spend is useful context, but infrastructure complexity and available capacity matter too.
What is the difference between cloud cost management and cloud cost optimization?
Cloud cost management is the broader discipline. It includes visibility, allocation, forecasting, governance, and reporting.
Cloud cost optimization focuses on reducing spend. Common strategies include commitment management, rightsizing, removing idle resources, and changing pricing tiers.
Optimization is one part of a complete cloud cost management practice.
Are native cloud tools enough?
Native tools can be enough while infrastructure remains simple.
AWS Cost Explorer, GCP Cost Management, and Microsoft Cost Management provide billing reports, budgets, alerts, and optimization insights.
Companies may need additional tooling when:
- Spend spans more than one provider
- Shared costs require business-level allocation
- Commitment management becomes time-consuming
- Teams need automated action instead of recommendations alone
The right time to add another platform depends on complexity, not one fixed spend threshold.
How much can cloud cost management tools save?
Savings depend on current usage, existing commitments, and infrastructure efficiency.
Teams paying mostly on-demand rates may find larger opportunities. Others may save through rightsizing, idle resource cleanup, or better commitment coverage.
The most useful estimate comes from analyzing the current environment. Broad savings percentages rarely apply evenly across providers, services, and workloads.
What is the best cloud cost management tool?
There's no single best tool, the right choice depends on spend, provider mix, and how much automation a team needs.
For teams that want cloud, AI, and data spend handled in one platform, North.cloud is built for that scope. Noros is also available on its own, for teams that want plain-language cost answers before adding broader automation.
How much can companies save with North.cloud?
Savings depend on current rates, commitments, and resource efficiency.
North reports cloud savings of up to 50% across its customer base. The platform combines commitment management, rightsizing, and continuous monitoring across AWS, GCP, and Azure.
Results vary based on workload stability, provider mix, and existing optimization coverage.